Alternatives to Walled Garden Reporting: Building Independent Cross-Channel Visibility
Tatev Malkhasyan
March 25, 2026
11
minutes read
Every platform tells advertisers a version of the truth—the version that favors its own contribution. Building a complete picture of cross-channel performance means stepping outside those closed ecosystems and measuring on neutral ground.
The reporting challenge in digital advertising is not a lack of data. It is the opposite. Every platform generates enormous volumes of performance metrics—impressions, clicks, conversions, return on ad spend—but each one does so within its own closed system. Google measures performance using its attribution logic. Meta uses a different model. Amazon applies yet another. When a marketer tries to compare results across these systems, the numbers rarely reconcile. A single conversion might be claimed by two or three platforms at once, while the channels that actually assisted that conversion go unrecognized.
This fragmentation has real consequences. Budgets get allocated based on whichever dashboard tells the most flattering story, not on which channels genuinely contribute to business outcomes. And as campaign strategies grow more complex—spanning display, CTV, social, search, native, and audio—the gap between platform-reported performance and actual cross-channel effectiveness continues to widen.
This article examines why relying solely on platform-reported metrics creates blind spots, why cross-channel measurement breaks down so consistently, and what structural alternatives to walled garden measurement look like in practice. It also explores why reporting tools alone cannot solve this problem and why the industry is moving toward governance-level frameworks for measurement integrity.
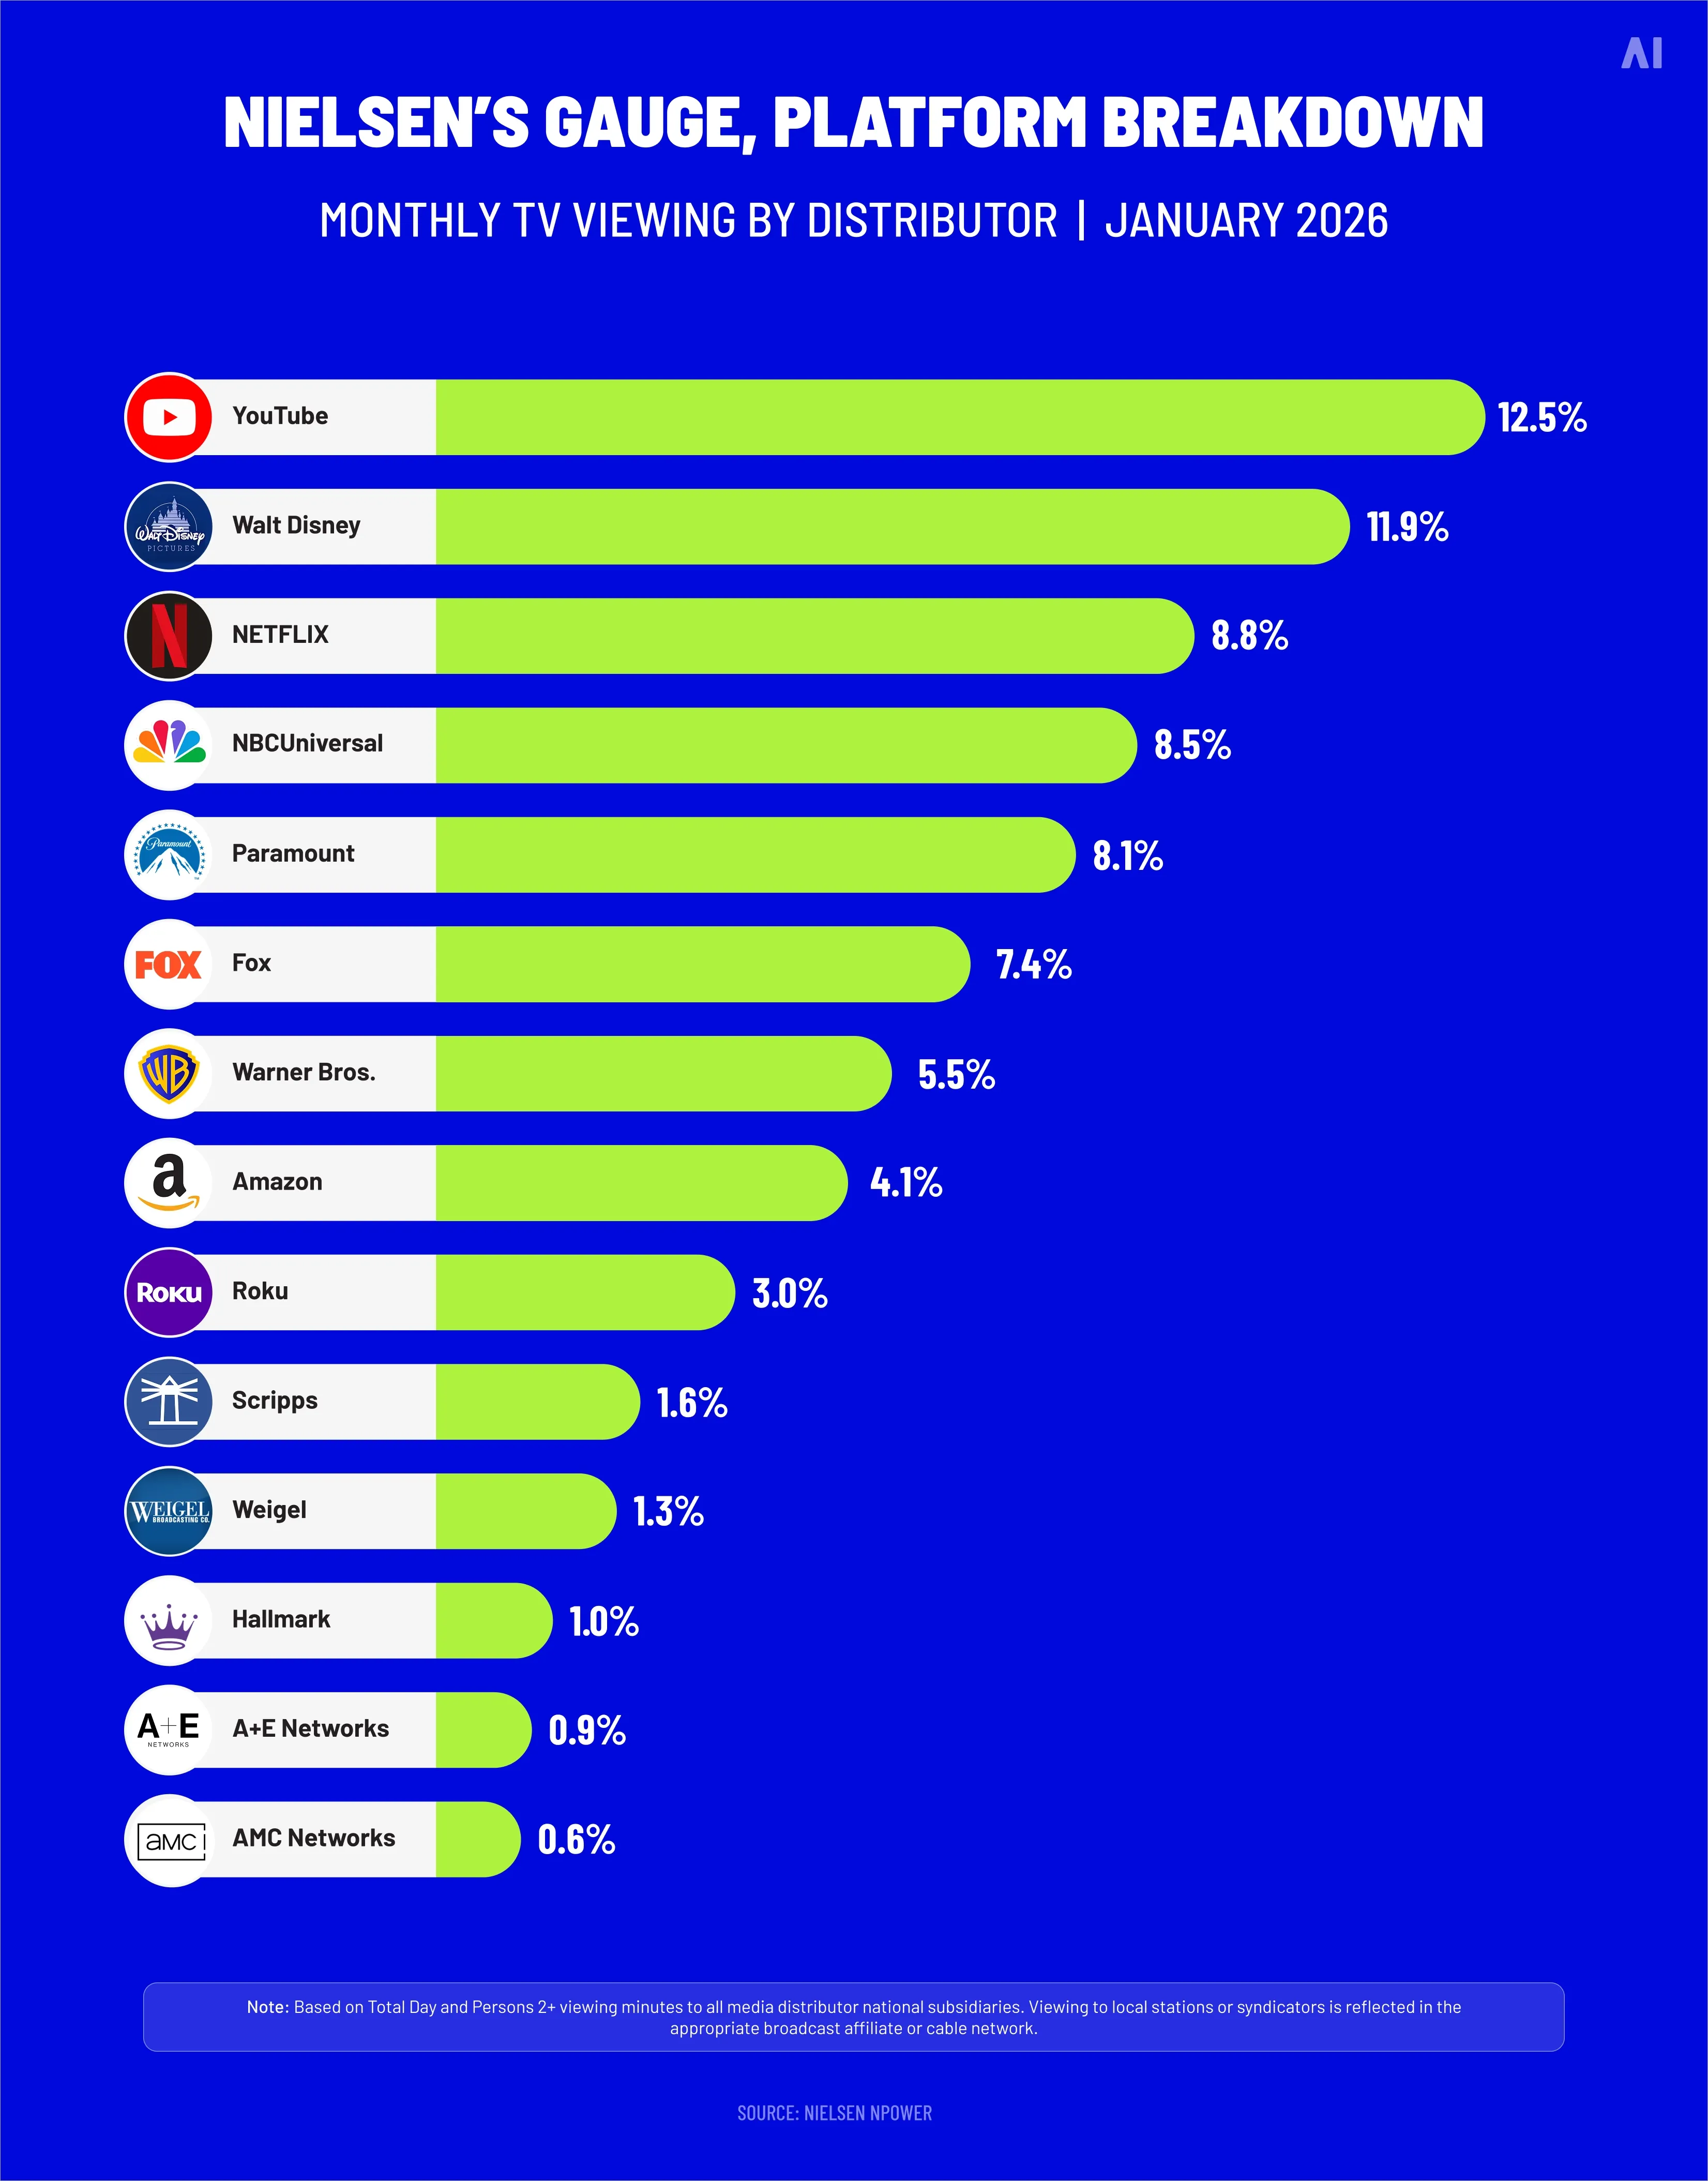
Monthly TV viewing by platform fragmentation (Source)
What is walled garden reporting?
Walled garden reporting refers to performance metrics that are generated, controlled, and presented by the advertising platforms themselves. When a marketer runs a campaign through Google Ads and reviews performance in Google's dashboard, that reporting exists entirely within Google's ecosystem. The same applies to Meta Business Manager, Amazon Advertising Console, and other major platforms. These systems are designed to help advertisers optimize campaigns within that specific environment, but they are not designed to provide a neutral, cross-platform view.
The platforms that operate as walled gardens—primarily Google, Meta, and Amazon—control the entire ad tech stack within their ecosystems: buying, serving, tracking, and reporting. Their reporting is proprietary, their data stays within their walls, and independent verification is limited by design. By 2027, walled gardens are projected to capture approximately 83% of global digital advertising revenue, leaving just 17% for the open internet. That concentration of spend inside closed ecosystems makes the reporting limitations a significant concern for any advertiser managing a multi-channel strategy.
The blind spots in platform-reported performance are not the result of any single flaw. They emerge from three interconnected structural issues: the way platforms model attribution, the fragmentation of data across ecosystems, and the limited visibility that results when these siloed systems are the only lens available. Each one compounds the others.
Platform attribution models
Every major advertising platform uses a proprietary attribution model that determines how credit is assigned when a user converts. Google, for instance, has historically favoured last-click attribution, meaning that if a user clicks a Google ad before purchasing, Google claims full credit for that conversion—regardless of how many other touchpoints contributed to the decision. Meta uses its own data-driven model that prioritizes interactions within its ecosystem, and Amazon ties conversions to its deterministic purchase data.
The problem is not that these models are wrong in isolation. Each one provides a defensible view of performance within its own context. The problem is that each platform's attribution model is built to favour its own contribution. When an advertiser aggregates reports from Google, Meta, and Amazon, the combined conversion totals will almost certainly exceed the actual number of conversions recorded. This is not a bug. It is a structural feature of how walled gardens report performance.
Data generated inside one walled garden cannot easily be reconciled with data from another. Google does not share user-level data with Meta. Meta does not share engagement signals with Amazon. Each platform operates on its own identity graph, its own event taxonomy, and its own reporting cadence. The result is a set of disconnected data sets that cannot be merged without significant manual effort and a range of assumptions about how to normalize the differences.
This fragmentation is particularly acute in mobile environments. A September 2025 survey by Branch found that only 8% of companies have a fully unified view of their app marketing performance across multiple channels. The remaining 92% are working with partial data, cobbled together from individual platform reports that were never designed to be compared.
Limited cross-channel visibility
When marketers cannot see how different channels interact, they default to optimizing each channel in isolation. Search gets optimized for search metrics. Social gets optimized for engagement. Display gets optimized for impressions. But the customer does not experience these channels in isolation. Research suggests that consumers typically engage with brands 3+ times across digital channels before purchase, rising to 5+ touchpoints for higher-income consumers. Without cross-channel visibility, the interactions between these touchpoints—where display primes a search conversion, or where a CTV spot drives a direct site visit—remain invisible.
Why cross-channel measurement breaks down
Modern advertising strategies rarely rely on a single channel. A typical campaign might combine programmatic display for reach, paid social for engagement, search for intent capture, and CTV for brand awareness—all running concurrently, all targeting overlapping audience segments. The expectation is that these channels will reinforce one another. The reality is that measuring that reinforcement is extraordinarily difficult.
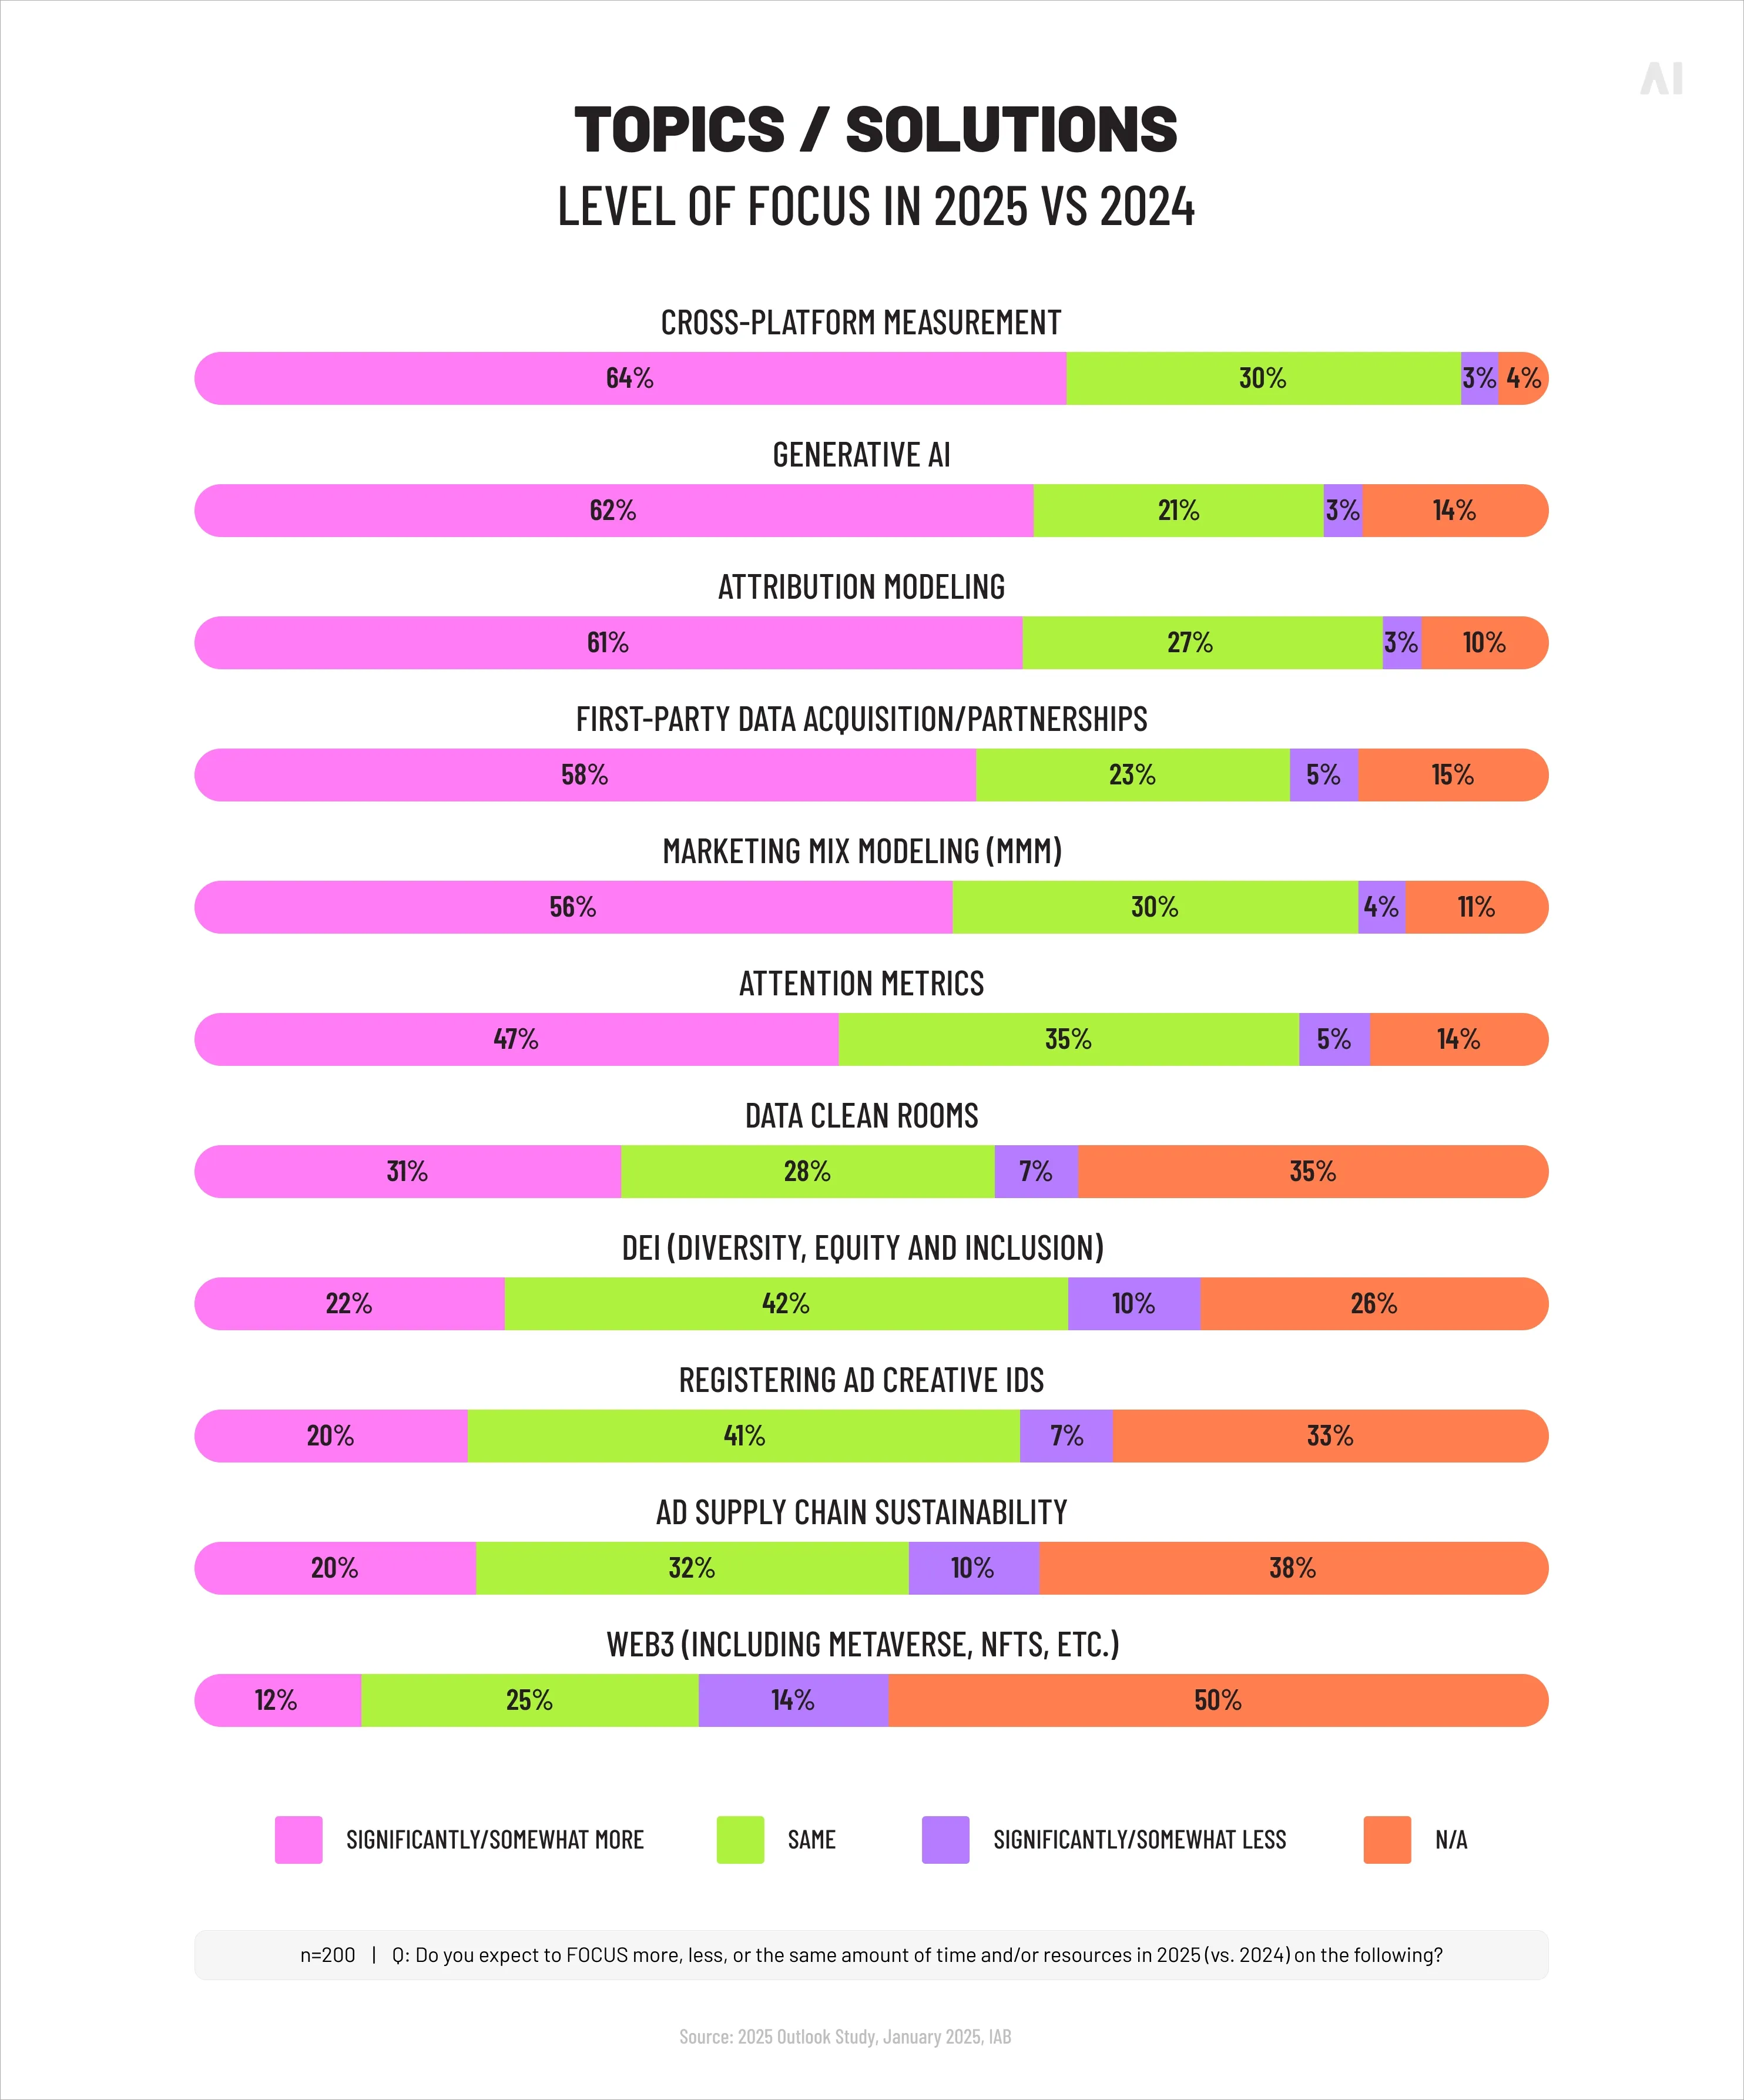
The core issue is structural. Walled gardens operate in isolation, and their reporting systems were never built to be interoperable. Google's attribution data does not connect to Meta's. Meta's does not connect to Amazon's. Each platform reports on what it can see—its own touchpoints—and ignores everything else. When attribution models from different platforms conflict, there is no neutral arbiter to resolve the disagreement. A December 2024 IAB survey found that 64% of US ad buyers plan to focus significantly more on cross-platform measurement in the near term, a clear signal that current systems are not meeting the need.
The challenge is compounded by the absence of shared standards. Different platforms use different lookback windows, different conversion definitions, and different methodologies for counting events. Even something as basic as what constitutes a "view" or a "click" varies from platform to platform. These inconsistencies make it functionally impossible to produce a reliable cross-channel performance report using platform-reported data alone.
💡 For a detailed comparison of how closed and open ecosystems handle these challenges differently, see our forthcoming article: Walled gardens vs open internet.
The illusion of performance inside closed ecosystems
Platform dashboards are designed to present performance in the most compelling way possible. This is not cynical—platforms genuinely want their advertisers to succeed, because advertiser success drives repeat spend. But it does mean that the metrics displayed inside these dashboards tend to paint an optimistic picture, one that may not reflect actual business outcomes.
⚡ The numbers inside any single platform's dashboard will almost always look better than the numbers that emerge from an independent, deduplicated cross-channel analysis.
Overlapping attribution is one of the most persistent issues. When multiple platforms claim credit for the same conversion, the advertiser's reported total can significantly overstate actual results. Only 50% of marketers, on average, say they’re extremely or very confident in their ability to measure full-funnel ROI across channels. Double-counting inflates performance metrics, skews budget allocation, and creates a false sense of confidence in channels that may not be performing as strongly as they appear.
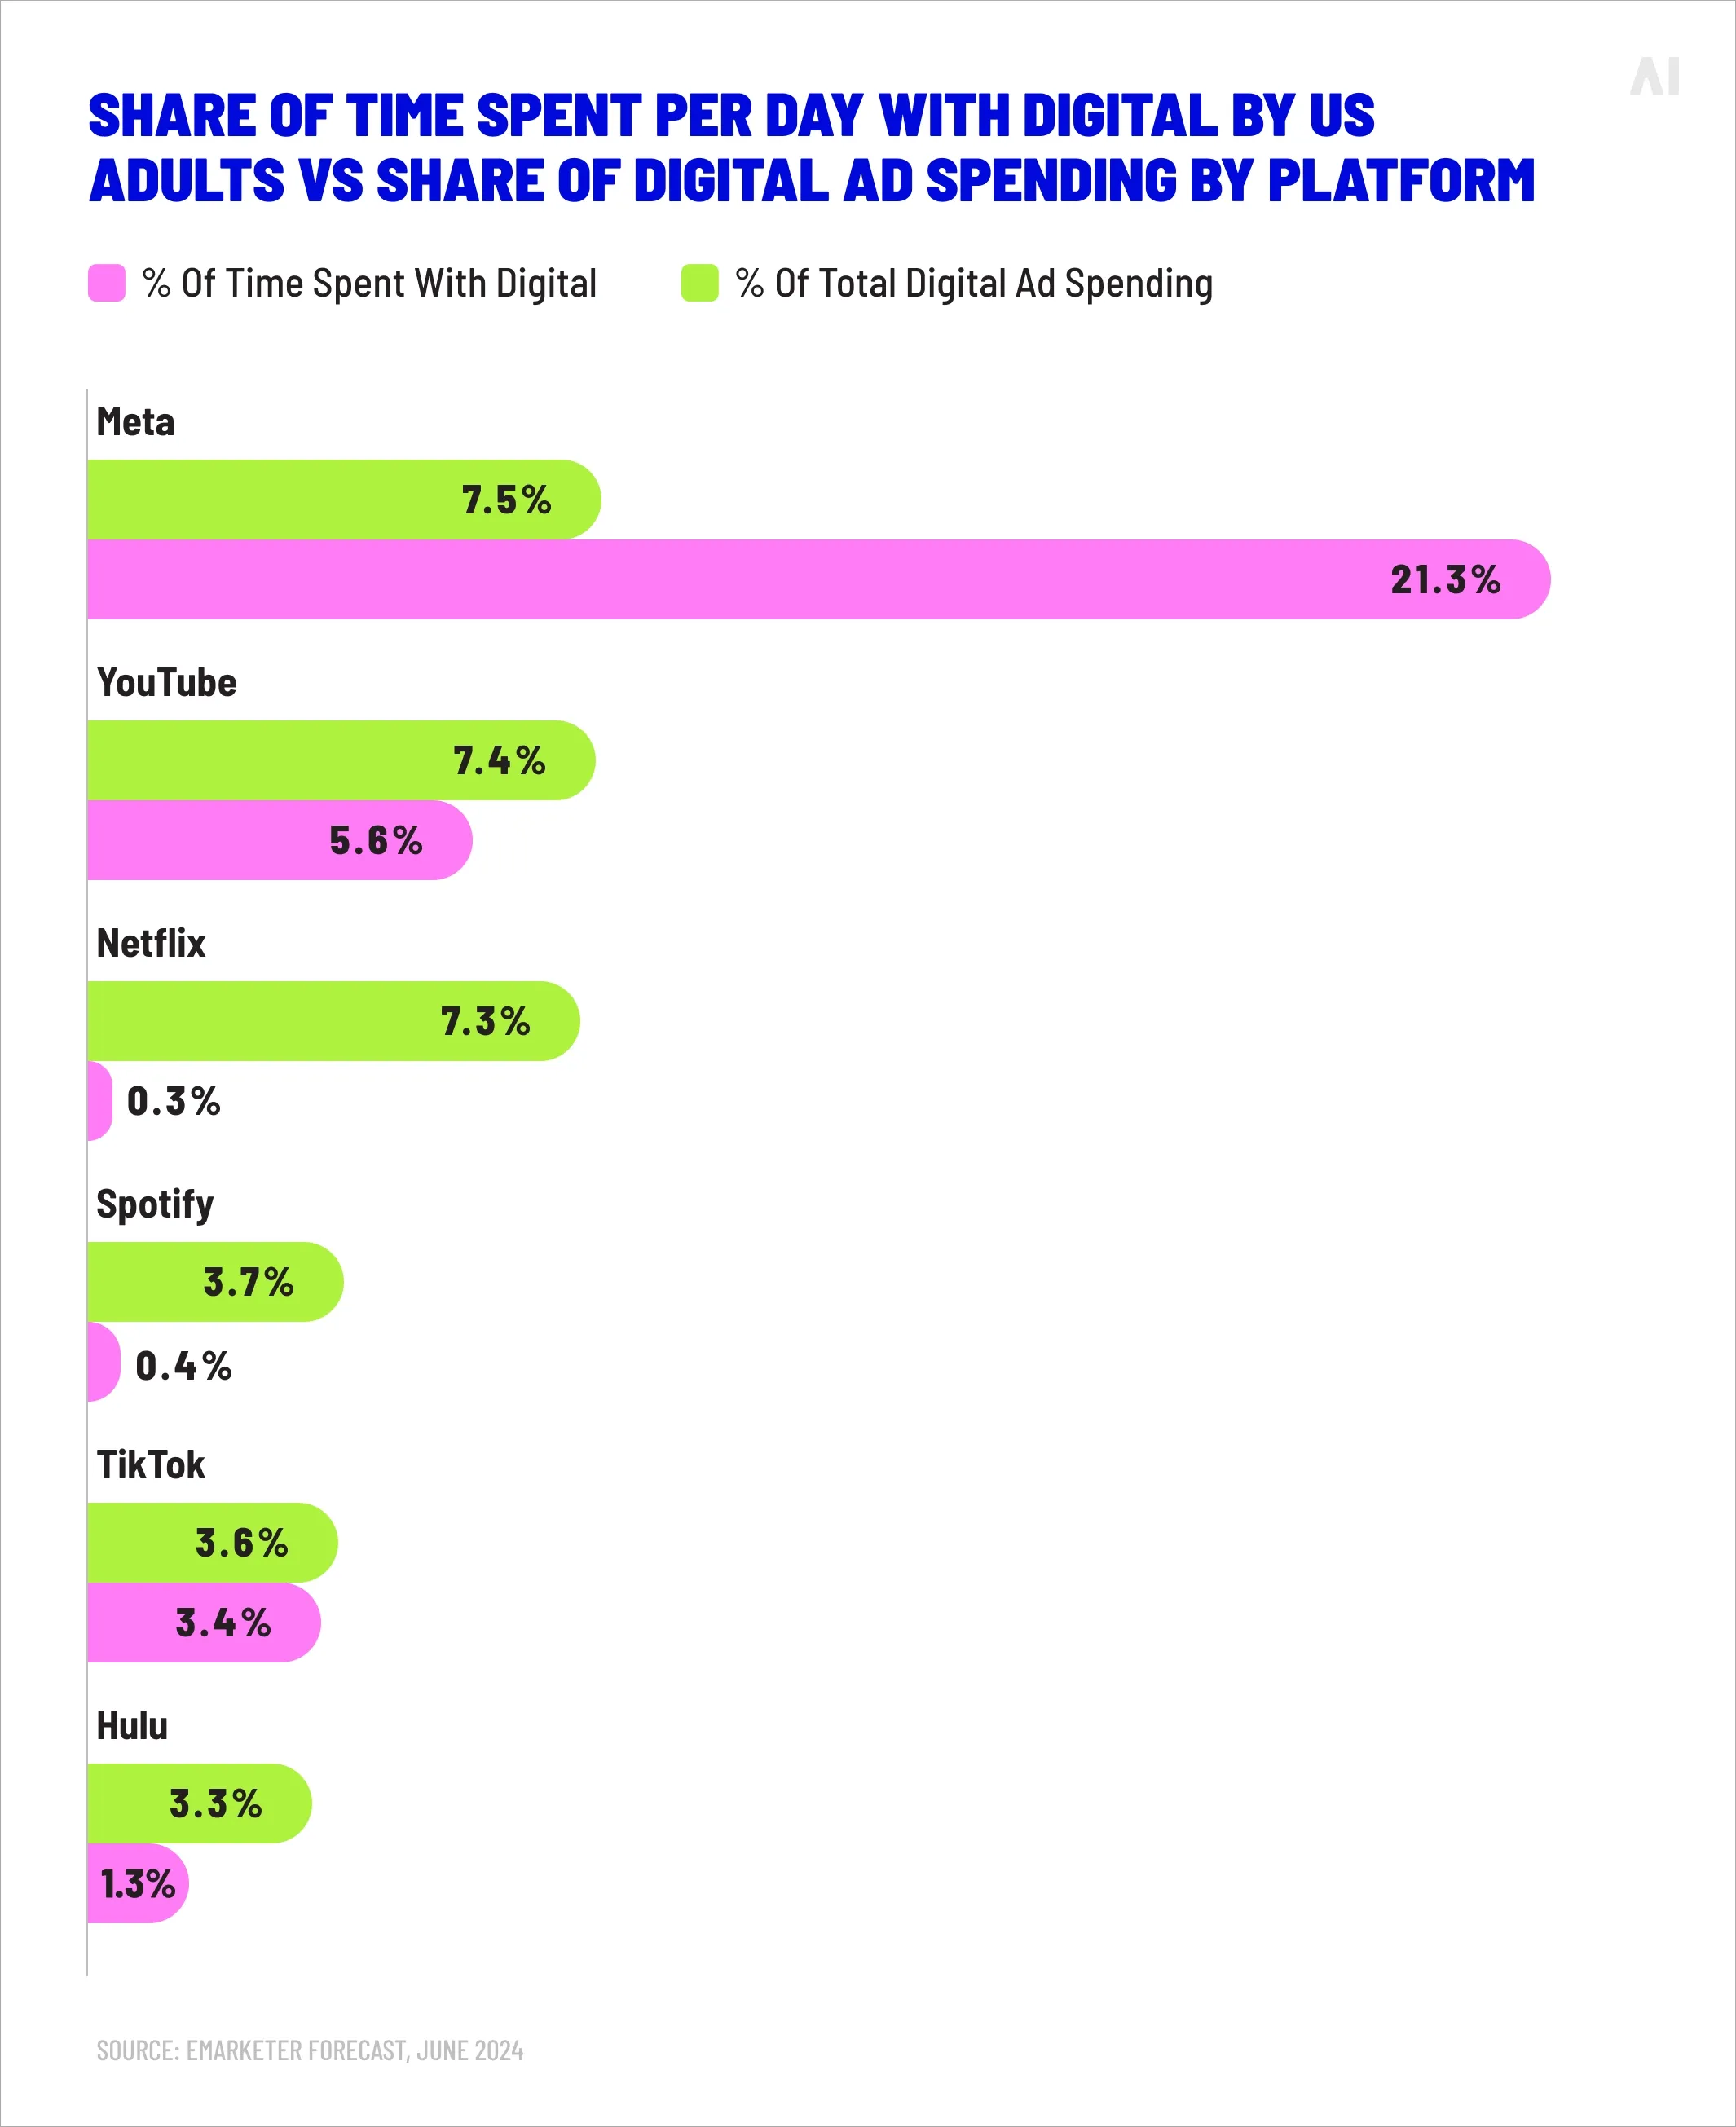
There is also a disconnect between spend share and audience attention. One analysis noted that Meta captured 21% of total US digital ad spend but accounted for just 7.5% of users' time spent with digital media. That gap suggests a mismatch between where budgets are concentrated and where audiences actually engage—a mismatch that platform-reported metrics are unlikely to surface on their own.
Share of time spent per day with digital by US adults vs share of digital ad spending by platform (Source)
These issues reinforce why advertisers need independent verification frameworks. Without a neutral layer that deduplicates conversions and reconciles conflicting attribution claims, marketers are making budget decisions based on a composite picture that each platform has, understandably, drawn in its own favour.
What independent cross-channel visibility actually means
Independent cross-channel visibility is the ability to analyse campaign performance across multiple platforms using neutral measurement frameworks that are not controlled by any single advertising ecosystem. It means looking at the entire media mix through a consistent lens, rather than relying on each platform's self-reported version of events.
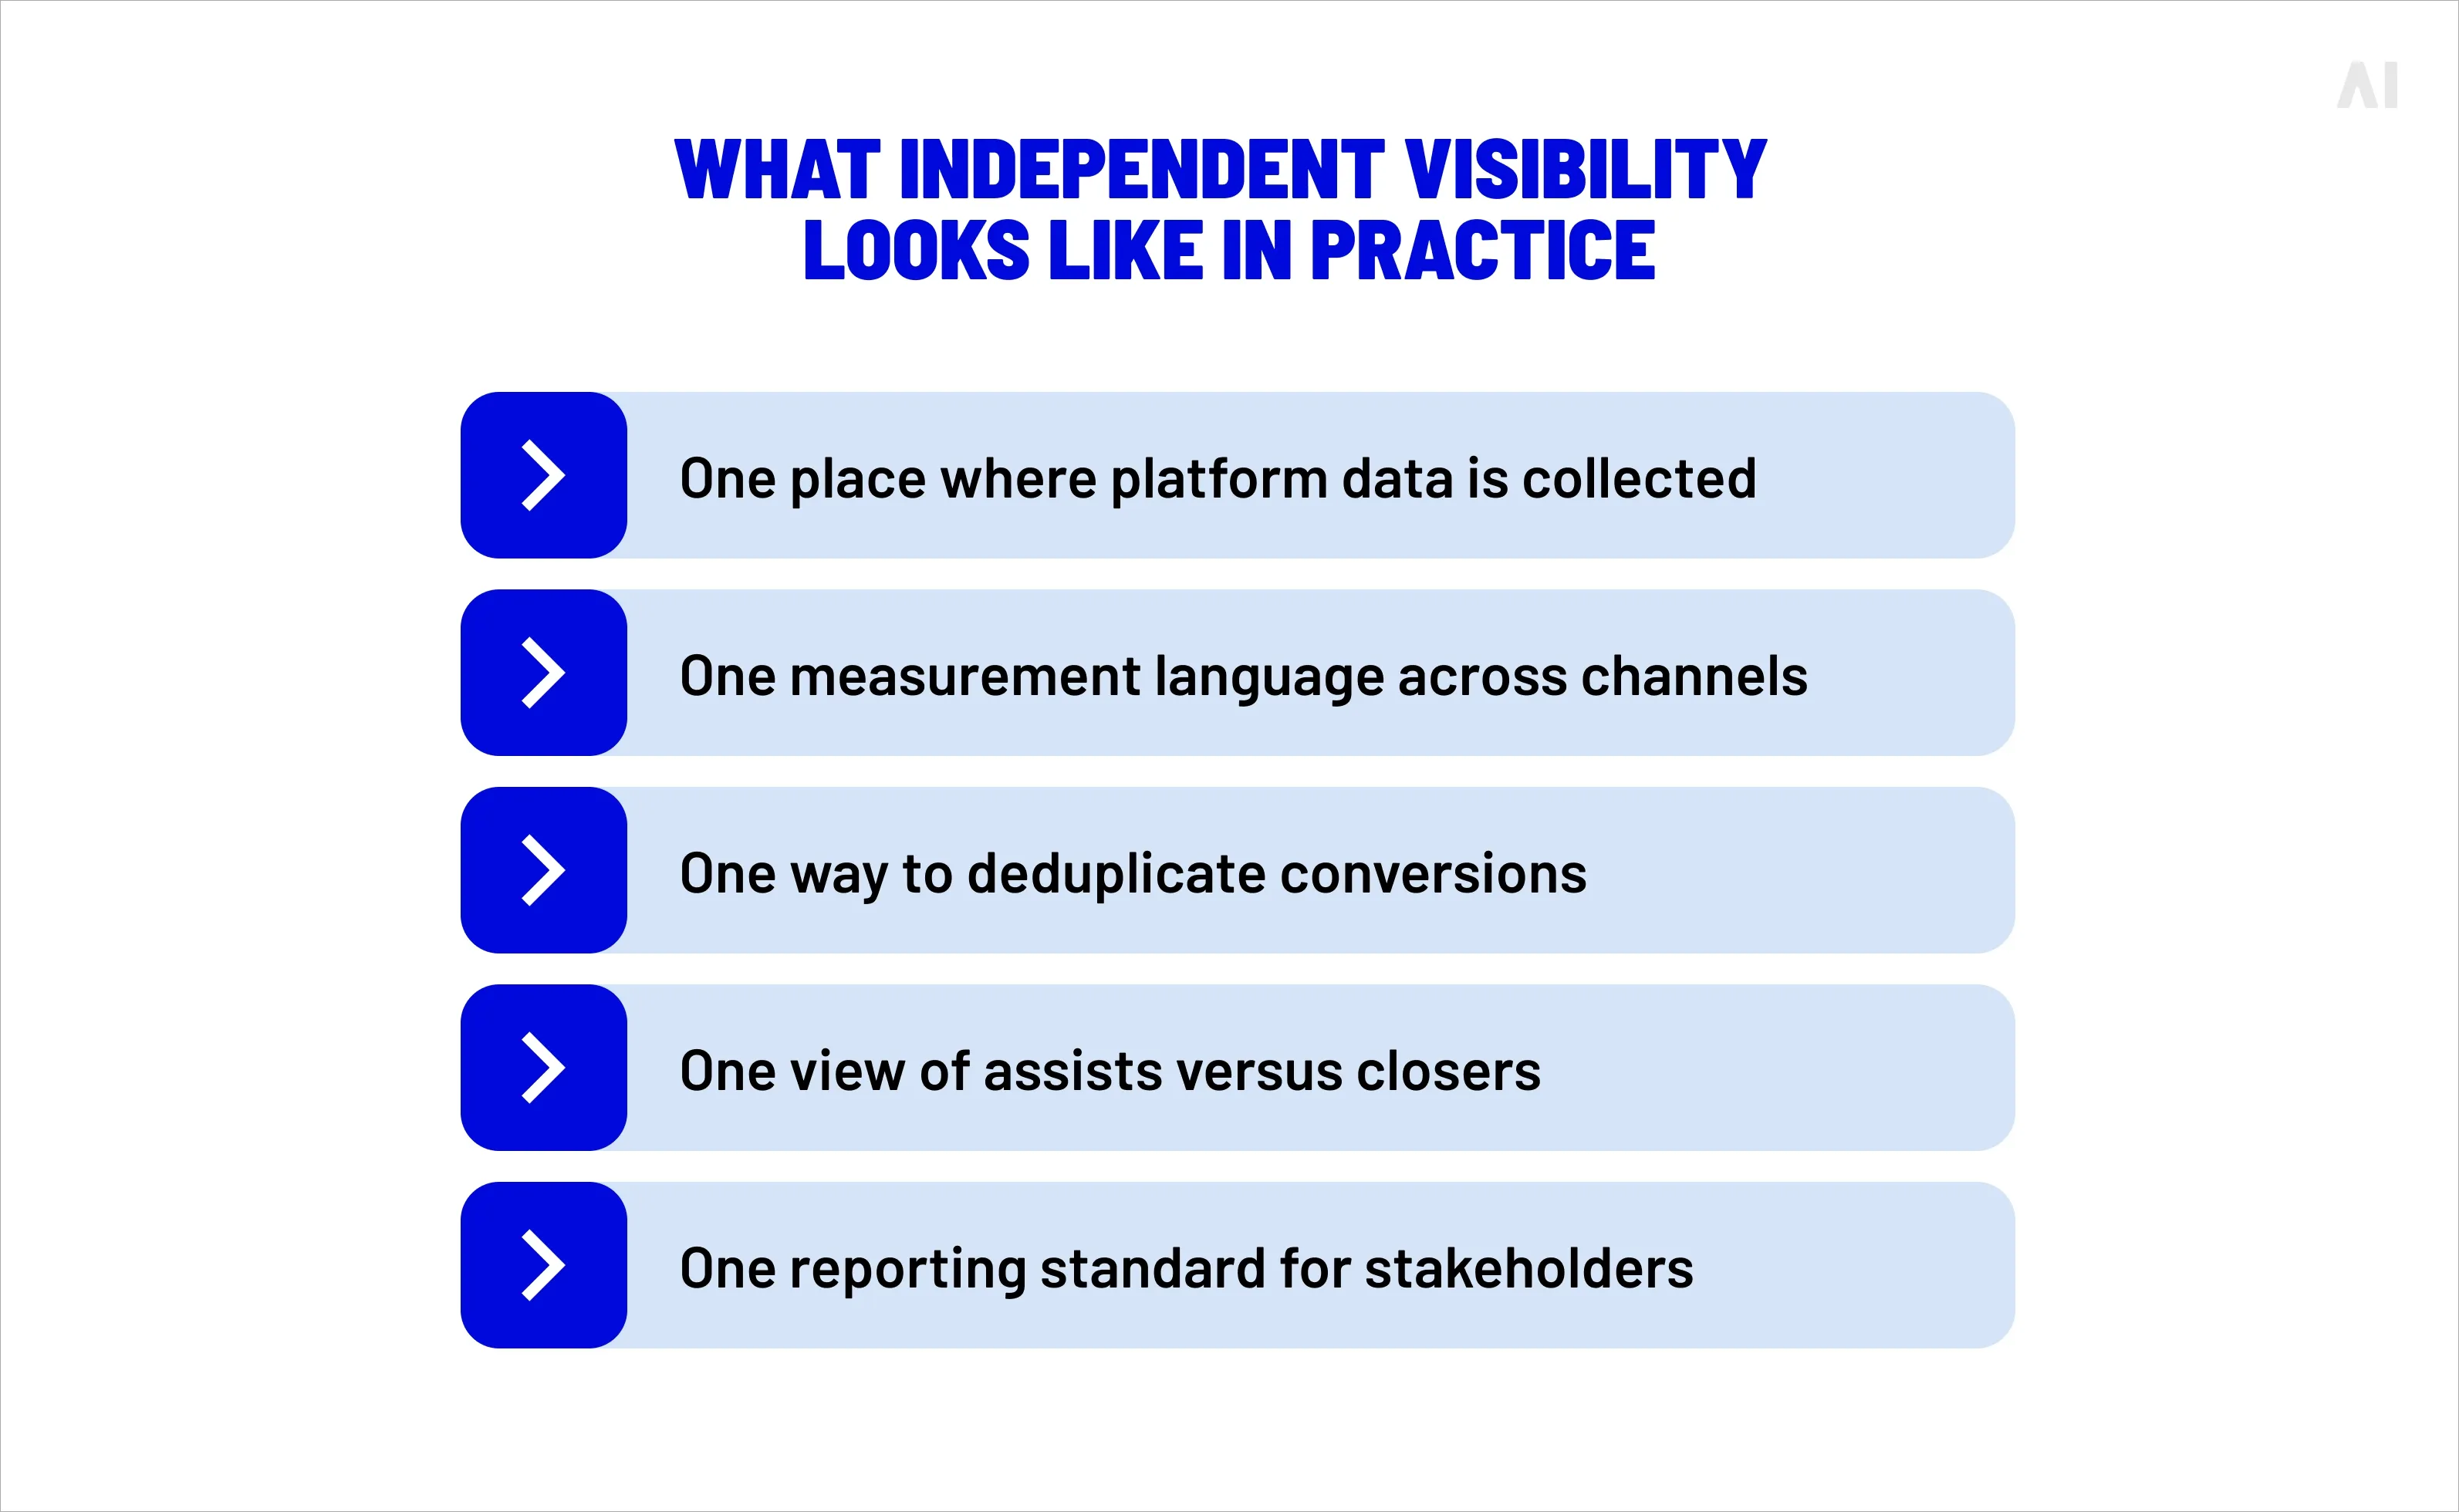
Building this capability requires three foundational elements:
Centralized data aggregation. Performance data from every active platform—walled gardens and open web alike—must be collected and stored in a unified environment. This includes impression data, click data, conversion data, and cost data, normalized into consistent formats and taxonomies.
Cross-platform attribution models. Rather than accepting each platform's proprietary attribution, advertisers apply a single model (or a complementary set of models, such as multi-touch attribution combined with media mix modelling) across all channels. This produces a deduplicated, consistent view of how each channel contributes to outcomes.
Consistent reporting structures. Standardized definitions for key metrics—what counts as a conversion, which lookback windows apply, how assist interactions are credited—must be applied uniformly. Without this consistency, any aggregated report is just another collection of incompatible numbers.
💡Independent visibility does not mean abandoning platform data. It means contextualizing it—placing it within a framework where every channel is measured by the same rules.
When these elements are in place, marketers can begin to see how channels work together rather than treating each one as a standalone performance story. This is where alternatives to walled garden data become most valuable: not as replacements for platform insights, but as a governance layer that reconciles them.
Structural alternatives to walled garden reporting
No single solution addresses every dimension of the cross-channel visibility problem. Instead, advertisers typically draw on a combination of approaches—each tackling a different layer of the challenge, from raw data infrastructure to privacy-safe collaboration to unified reporting. The three most established structural alternatives are worth examining in turn.
The most straightforward alternative to walled garden ad solutions is to consolidate data from multiple platforms into an independent analytics environment. This typically involves pulling data through APIs—Google Ads API, Meta Marketing API, Amazon Advertising API—into a centralized data warehouse such as BigQuery, Snowflake, or Redshift. From there, analysts can apply consistent attribution logic, deduplicate conversions, and produce reports that reflect actual cross-channel performance.
This approach requires significant technical investment. API integrations must be maintained as platforms update their data access policies. Data must be cleaned, normalized, and validated on an ongoing basis. And the attribution models applied to this consolidated data must be thoughtfully designed to avoid introducing new biases while correcting for the ones inherent in platform reporting.
For organizations with the resources to build and maintain this infrastructure, independent analytics frameworks provide the highest degree of control and customization. They also create a foundation for more advanced measurement techniques, including incrementality testing and econometric modelling.
Data clean rooms
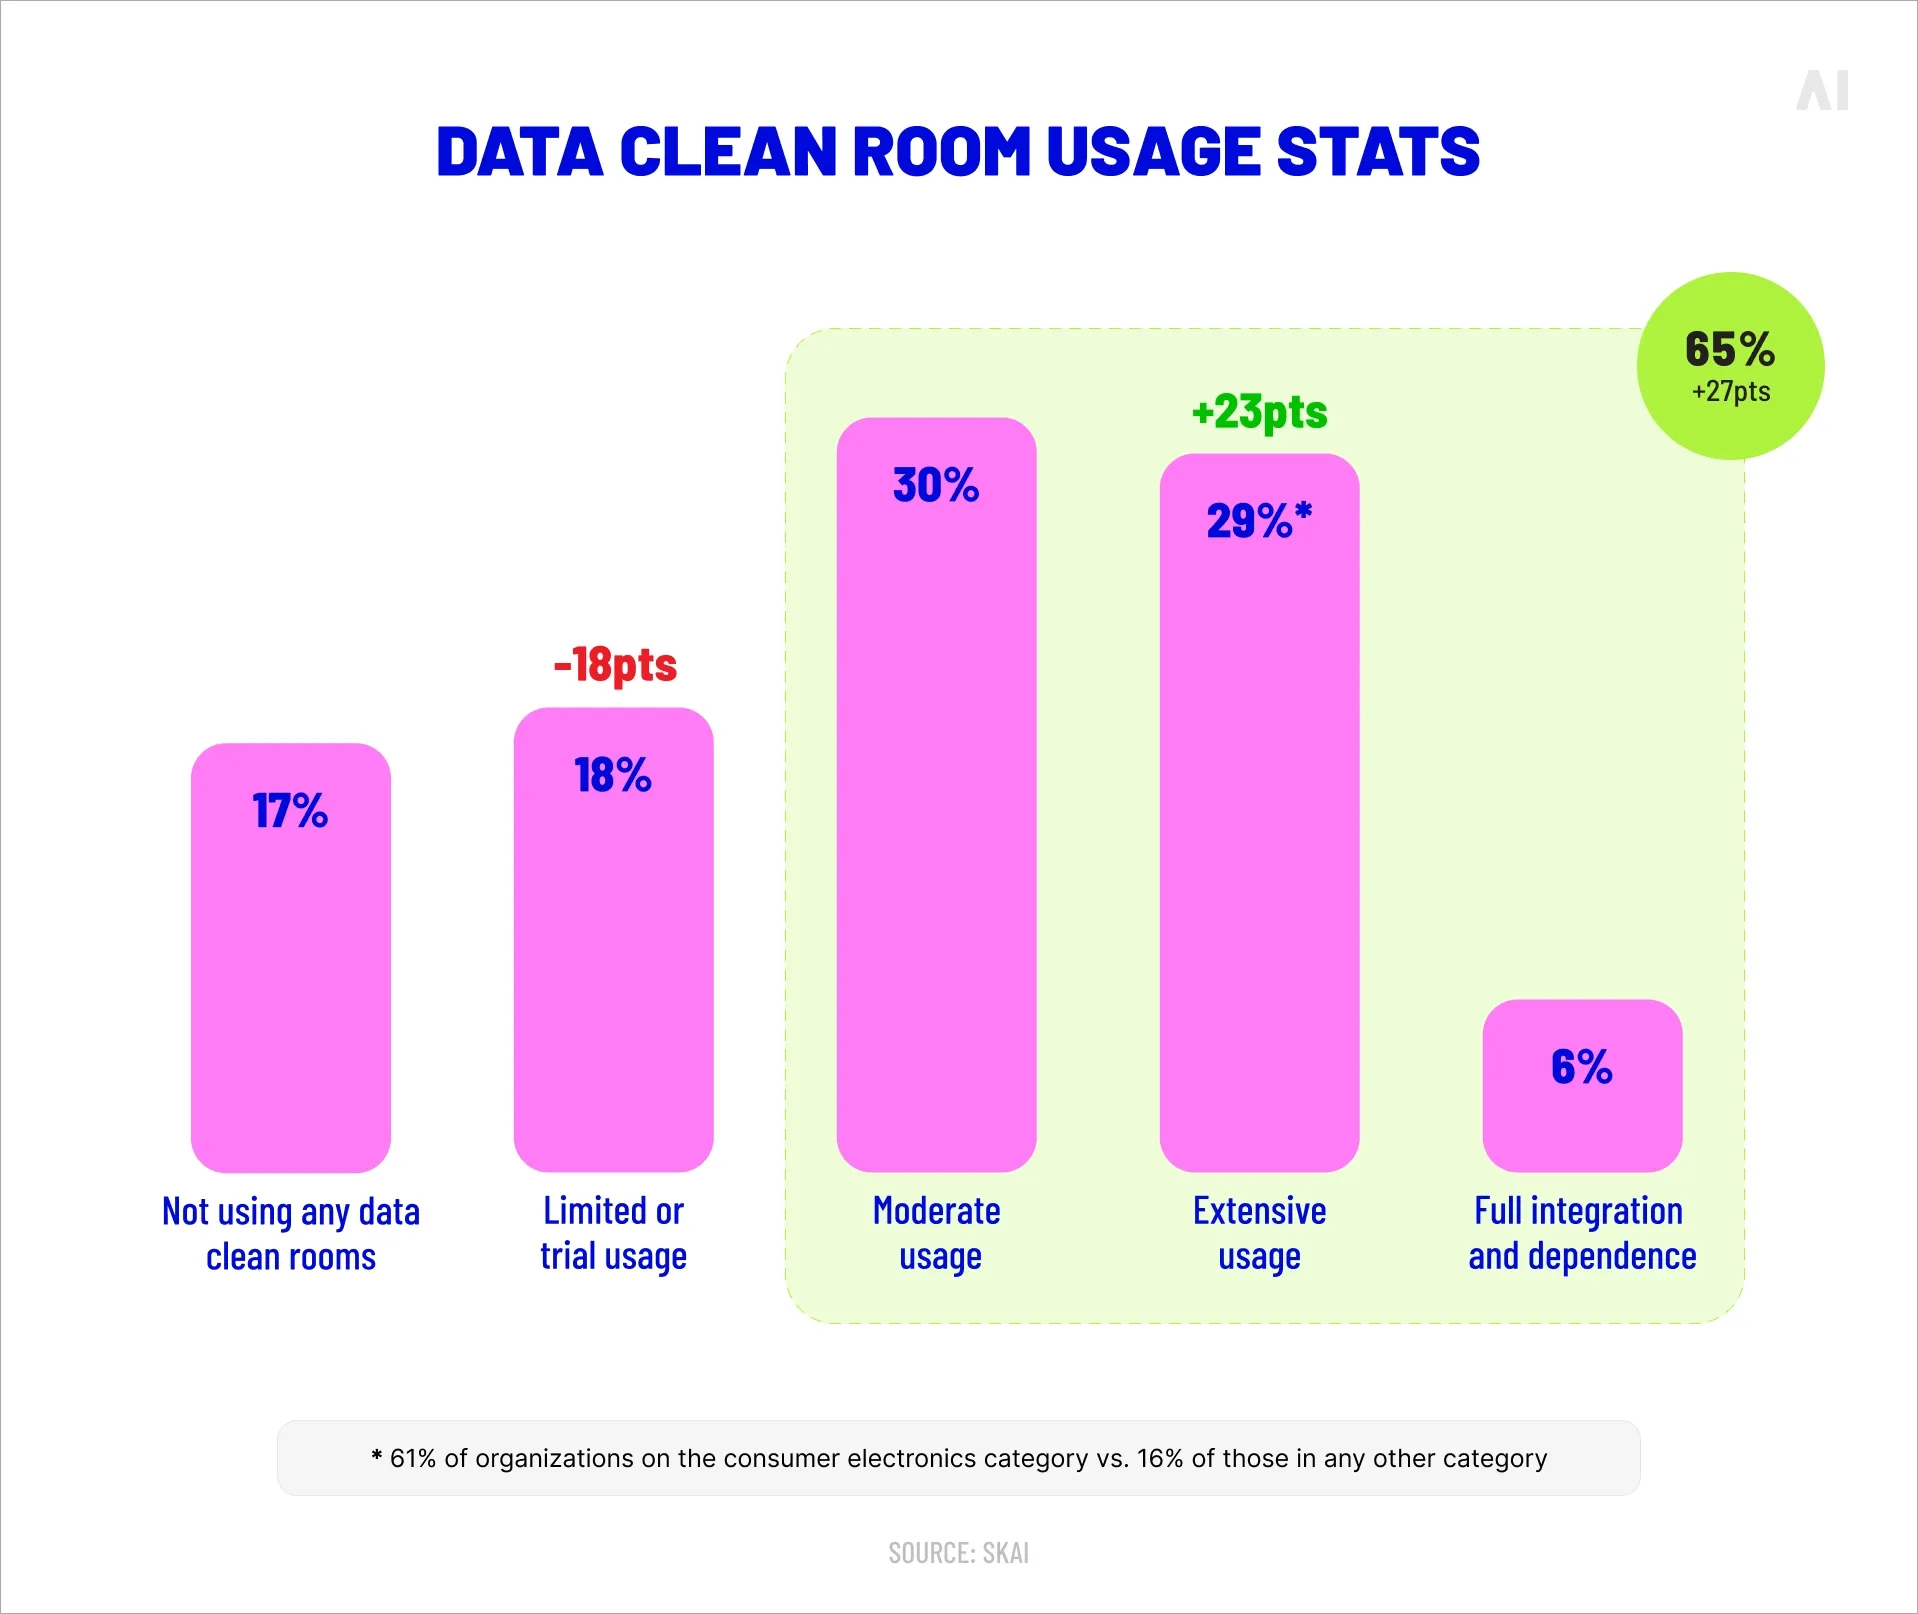
Data clean rooms are privacy-safe environments that allow platforms and advertisers to collaborate on aggregated data analysis without exposing raw user-level information. They have become increasingly important as privacy regulations tighten and traditional cross-platform tracking mechanisms erode.
The growth trajectory is significant. The global data clean room market for advertising reached $1.42 billion in 2024 and is projected to grow at a 22.1% CAGR through 2033. Adoption is accelerating, too: approximately 66% of organizations now use clean rooms in some form, according to a 2025 industry report. However, adoption alone does not guarantee effectiveness. The same research found that 39% of organizations struggle to extract actionable insights from their clean room implementations, often due to a lack of SQL expertise, integration challenges, or insufficient internal data science resources.
Clean rooms are particularly valuable in retail media, where deterministic purchase data can be matched against ad exposure data to produce closed-loop attribution. They also support audience overlap analysis, reach measurement, and incrementality testing—all of which are difficult or impossible using platform dashboards alone.
💡 For more on how clean rooms work and where they fit in modern ad tech, see our forthcoming article: Data clean rooms.
Cross-channel reporting platforms
Specialized reporting platforms sit between raw data infrastructure and business decision-making, offering pre-built integrations with major advertising platforms and standardized frameworks for cross-channel analysis. These tools aggregate performance data from multiple sources, apply consistent attribution logic, and present results in unified dashboards.
Elevate, AI Digital's intelligence platform, is one example of this approach. It aggregates performance data across multiple DSPs and channels, applies cross-platform attribution analysis, and provides real-time reporting that is not tied to any single platform's ecosystem. By operating within a DSP-agnostic framework, platforms like Elevate can offer a neutral view of performance that helps advertisers identify which channels are genuinely contributing to outcomes and which are benefiting from favourable self-attribution.
The key advantage of cross-channel reporting platforms is speed to insight. While building a custom analytics framework from scratch can take months, dedicated platforms offer structured environments where cross-channel analysis is a default capability rather than a custom build.
Why tools alone are not enough
Reporting tools—whether custom-built or off-the-shelf—can aggregate data and apply attribution models. But they cannot, on their own, solve the structural challenges that make cross-channel measurement so difficult. Tools process the data they receive. If that data is inconsistent, poorly defined, or incompletely integrated, the outputs will reflect those limitations.
Effective independent reporting requires a broader foundation:
Clear governance frameworks. Someone must own the measurement strategy — defining which attribution model applies, how conflicts between data sources are resolved, and how results are communicated to stakeholders. Without governance, even the best tools produce reports that different teams interpret differently.
Standardized measurement definitions. Terms like "conversion," "engagement," "viewability," and "attribution window" must mean the same thing across every channel and every report. This sounds elementary, but in practice, getting alignment on definitions is one of the hardest parts of building cross-channel visibility.
Coordinated data integration strategies. Data from different platforms arrives at different frequencies, in different formats, with different levels of granularity. A coordinated integration strategy ensures that these differences are normalized before data enters the reporting environment, not after.
David Cohen, CEO of the IAB, put the challenge plainly at the organization's 2026 Annual Leadership Meeting: "While advanced measurement is widely used across the industry, it's still falling short of its core promise." That shortfall almost always traces back to governance rather than technology.
The shift toward governance-level reporting
The advertising industry is beginning to recognize that measurement is not just a technical function—it is a governance function. As campaign ecosystems grow more complex and the limitations of platform-reported data become more widely understood, the demand for structured, industry-wide measurement standards is intensifying.
The most significant recent development is the IAB's Project Eidos, announced in February 2026. This multi-year initiative aims to replace the current patchwork of channel-by-channel measurement systems with a unified, interoperable framework. Its three areas of focus—harmonizing measurement language and data flows, developing consistent cross-channel attribution and incrementality approaches, and modernizing media mix modelling—directly address the structural gaps that make independent cross-channel visibility so difficult today.
The initiative carries weight. Participating companies include Amazon Ads, Google, Meta, Unilever, General Motors, WPP Media, and The Trade Desk, among others. Shenan Reed, Global Chief Media Officer at General Motors, described the stakes clearly: to deliver business outcomes and sustainable growth, the industry must achieve "interoperability, transparency, and accountability" in how advertising performance is measured.
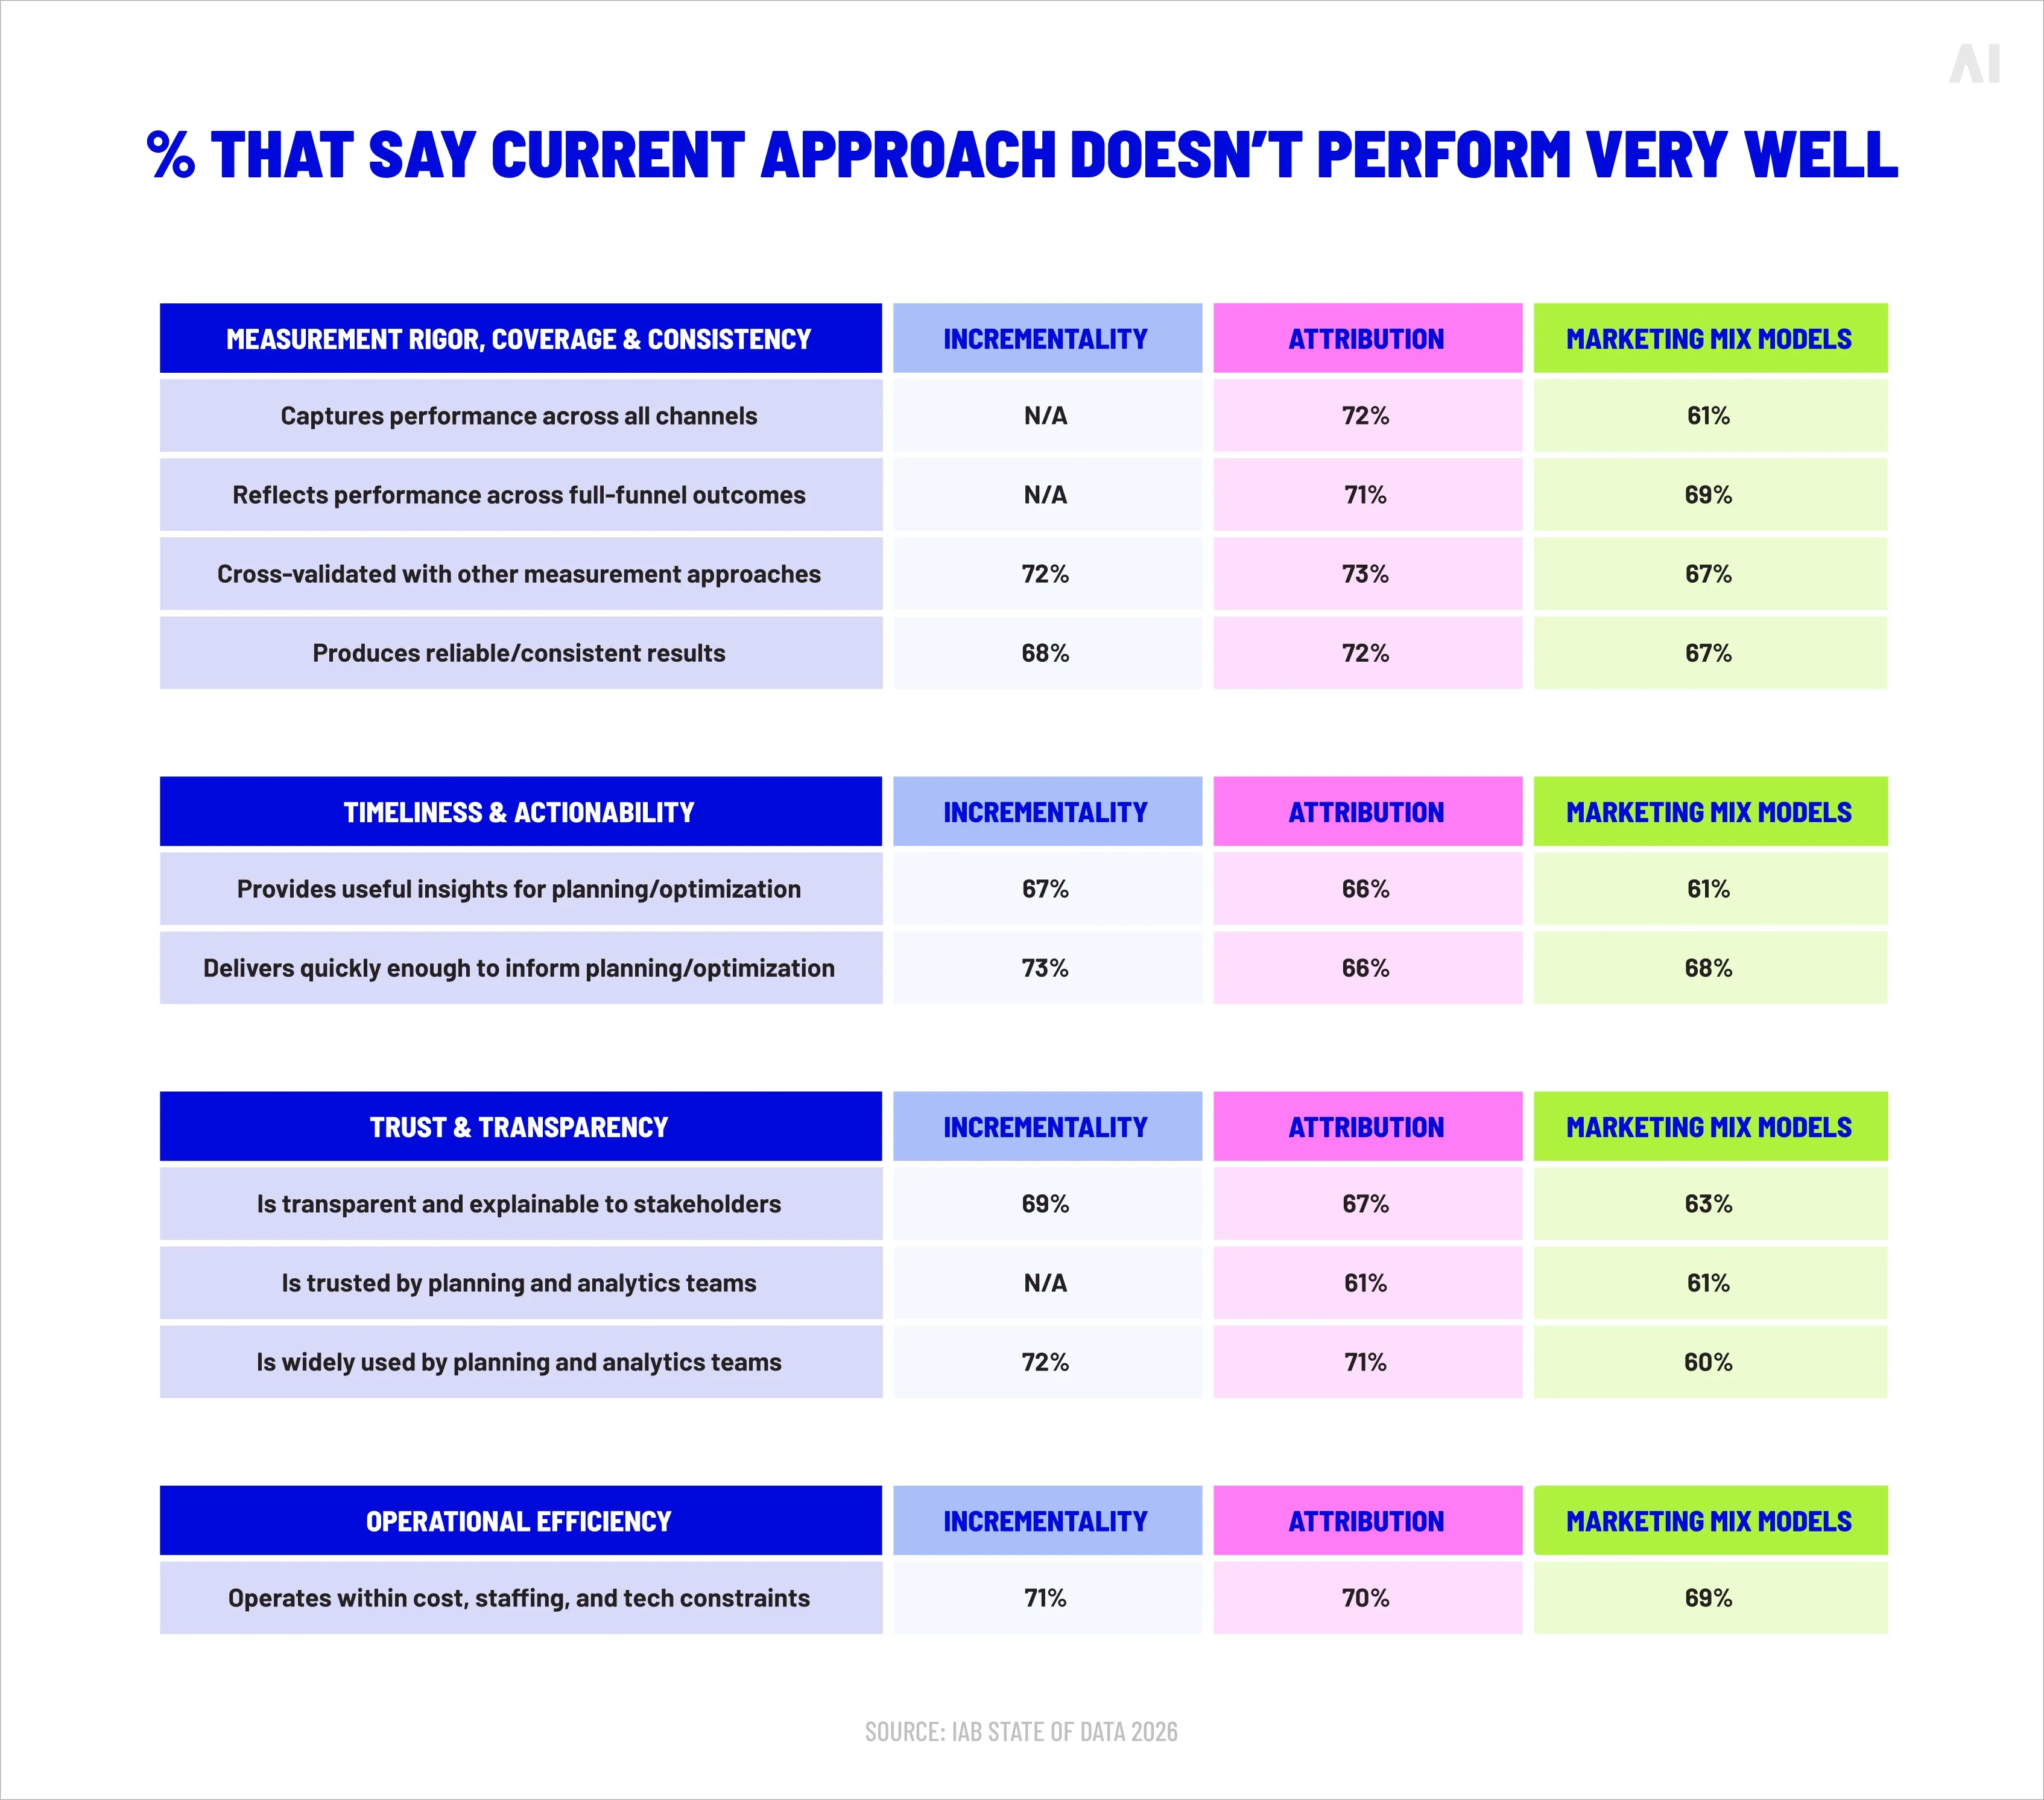
Alongside Project Eidos, the IAB State of Data 2026 report found that 60–75% of buy-side users of advanced measurement believe current approaches fall short on rigor, timeliness, trust, and efficiency. Critically, none of the respondents believed that all paid channels are adequately represented in current marketing mix models. These findings underscore a growing consensus: the industry needs coordinated, governance-level standards—not just better tools.
% that say current approach doesn’t perform very well (Source)
Conclusion: building independent visibility in a fragmented ecosystem
Platform-reported metrics will always have a role. They are essential for optimizing campaigns within individual ecosystems and for understanding how specific channels perform on their own terms. But they are not, and were never intended to be, a substitute for a unified view of cross-channel performance.
The case for alternatives to walled garden reporting rests on a simple observation: when every platform grades its own homework, the combined picture will always be distorted. Conversions will be double-counted. High-performing assist channels will be undervalued. Budgets will flow to whichever platform tells the most persuasive story rather than to whichever channel genuinely drives business outcomes.
Building independent cross-channel visibility is not a single purchase decision or a one-time implementation. It is an ongoing commitment to consistent measurement, neutral attribution, and structured governance — supported by the right combination of data infrastructure, reporting tools, and organizational alignment.
This is the thinking behind AI Digital's Open Garden framework —a DSP-agnostic approach designed to break down the silos that walled gardens create. Rather than locking advertisers into a single platform's ecosystem, Open Garden provides neutral, cross-platform media execution and unified performance reporting across 15+ DSPs. Combined with tools like Elevate for cross-channel intelligence and Smart Supply for supply-side management, it offers a practical foundation for the kind of independent visibility this article describes: transparent, unbiased, and built around business outcomes rather than platform metrics.
If your team is navigating the challenges of fragmented reporting and looking to build a more reliable cross-channel measurement framework, reach out to AI Digital to explore how an Open Garden approach can work for your media strategy.
Key takeaways for marketers
Independent cross-channel visibility helps brands evaluate performance beyond platform dashboards, reducing reliance on self-reported metrics that tend to overstate individual platform contributions.
Cross-platform attribution models, applied through centralized analytics frameworks, reveal how channels interact and where budget reallocation could improve overall results.
Data clean rooms offer a privacy-safe mechanism for collaborative measurement, particularly valuable in retail media and CTV where deterministic data can close the loop between exposure and purchase.
Tools are necessary but not sufficient. Governance frameworks that define measurement standards, resolve attribution conflicts, and standardize reporting definitions are equally critical.
Industry-wide initiatives like the IAB's Project Eidos signal that the shift toward interoperable measurement is accelerating. Brands that invest in independent reporting infrastructure now will be better positioned as these standards mature.
Blind spot
Key issues
Business impact
AI Digital solution
Lack of transparency in AI models
• Platforms own AI models and train on proprietary data • Brands have little visibility into decision-making • "Walled gardens" restrict data access
• Inefficient ad spend • Limited strategic control • Eroded consumer trust • Potential budget mismanagement
Open Garden framework providing: • Complete transparency • DSP-agnostic execution • Cross-platform data & insights
Optimizing ads vs. optimizing impact
• AI excels at short-term metrics but may struggle with brand building • Consumers can detect AI-generated content • Efficiency might come at cost of authenticity
• Short-term gains at expense of brand health • Potential loss of authentic connection • Reduced effectiveness in storytelling
Smart Supply offering: • Human oversight of AI recommendations • Custom KPI alignment beyond clicks • Brand-safe inventory verification
The illusion of personalization
• Segment optimization rebranded as personalization • First-party data infrastructure challenges • Personalization vs. surveillance concerns
• Potential mismatch between promise and reality • Privacy concerns affecting consumer trust • Cost barriers for smaller businesses
Elevate platform features: • Real-time AI + human intelligence • First-party data activation • Ethical personalization strategies
AI-Driven efficiency vs. decision-making
• AI shifting from tool to decision-maker • Black box optimization like Google Performance Max • Human oversight limitations
• Strategic control loss • Difficulty questioning AI outputs • Inability to measure granular impact • Potential brand damage from mistakes
Managed Service with: • Human strategists overseeing AI • Custom KPI optimization • Complete campaign transparency
Fig. 1. Summary of AI blind spots in advertising
Dimension
Walled garden advantage
Walled garden limitation
Strategic impact
Audience access
Massive, engaged user bases
Limited visibility beyond platform
Reach without understanding
Data control
Sophisticated targeting tools
Data remains siloed within platform
Fragmented customer view
Measurement
Detailed in-platform metrics
Inconsistent cross-platform standards
Difficult performance comparison
Intelligence
Platform-specific insights
Limited data portability
Restricted strategic learning
Optimization
Powerful automated tools
Black-box algorithms
Reduced marketer control
Fig. 2. Strategic trade-offs in walled garden advertising.
Core issue
Platform priority
Walled garden limitation
Real-world example
Attribution opacity
Claiming maximum credit for conversions
Limited visibility into true conversion paths
Meta and TikTok's conflicting attribution models after iOS privacy updates
Data restrictions
Maintaining proprietary data control
Inability to combine platform data with other sources
Amazon DSP's limitations on detailed performance data exports
Cross-channel blindspots
Keeping advertisers within ecosystem
Fragmented view of customer journey
YouTube/DV360 campaigns lacking integration with non-Google platforms
Black box algorithms
Optimizing for platform revenue
Reduced control over campaign execution
Self-serve platforms using opaque ML models with little advertiser input
Performance reporting
Presenting platform in best light
Discrepancies between platform-reported and independently measured results
Consistently higher performance metrics in platform reports vs. third-party measurement
Fig. 1. The Walled garden misalignment: Platform interests vs. advertiser needs.
Key dimension
Challenge
Strategic imperative
ROAS volatility
Softer returns across digital channels
Shift from soft KPIs to measurable revenue impact
Media planning
Static plans no longer effective
Develop agile, modular approaches adaptable to changing conditions
Brand/performance
Traditional division dissolving
Create full-funnel strategies balancing long-term equity with short-term conversion
Capability
Key features
Benefits
Performance data
Elevate forecasting tool
• Vertical-specific insights • Historical data from past economic turbulence • "Cascade planning" functionality • Real-time adaptation
• Provides agility to adjust campaign strategy based on performance • Shows which media channels work best to drive efficient and effective performance • Confident budget reallocation • Reduces reaction time to market shifts
• Dataset from 10,000+ campaigns • Cuts response time from weeks to minutes
• Reaches people most likely to buy • Avoids wasted impressions and budgets on poor-performing placements • Context-aligned messaging
• 25+ billion bid requests analyzed daily • 18% improvement in working media efficiency • 26% increase in engagement during recessions
Full-funnel accountability
• Links awareness campaigns to lower funnel outcomes • Tests if ads actually drive new business • Measures brand perception changes • "Ask Elevate" AI Chat Assistant
• Upper-funnel to outcome connection • Sentiment shift tracking • Personalized messaging • Helps balance immediate sales vs. long-term brand building
• Natural language data queries • True business impact measurement
Open Garden approach
• Cross-platform and channel planning • Not locked into specific platforms • Unified cross-platform reach • Shows exactly where money is spent
• Reduces complexity across channels • Performance-based ad placement • Rapid budget reallocation • Eliminates platform-specific commitments and provides platform-based optimization and agility
• Coverage across all inventory sources • Provides full visibility into spending • Avoids the inability to pivot across platform as you’re not in a singular platform
Fig. 1. How AI Digital helps during economic uncertainty.
Trend
What it means for marketers
Supply & demand lines are blurring
Platforms from Google (P-Max) to Microsoft are merging optimization and inventory in one opaque box. Expect more bundled “best available” media where the algorithm, not the trader, decides channel and publisher mix.
Walled gardens get taller
Microsoft’s O&O set now spans Bing, Xbox, Outlook, Edge and LinkedIn, which just launched revenue-sharing video programs to lure creators and ad dollars. (Business Insider)
Retail & commerce media shape strategy
Microsoft’s Curate lets retailers and data owners package first-party segments, an echo of Amazon’s and Walmart’s approaches. Agencies must master seller-defined audiences as well as buyer-side tactics.
AI oversight becomes critical
Closed AI bidding means fewer levers for traders. Independent verification, incrementality testing and commercial guardrails rise in importance.
Fig. 1. Platform trends and their implications.
Metric
Connected TV (CTV)
Linear TV
Video Completion Rate
94.5%
70%
Purchase Rate After Ad
23%
12%
Ad Attention Rate
57% (prefer CTV ads)
54.5%
Viewer Reach (U.S.)
85% of households
228 million viewers
Retail Media Trends 2025
Access Complete consumer behaviour analyses and competitor benchmarks.
Identify and categorize audience groups based on behaviors, preferences, and characteristics
Michaels Stores: Implemented a genAI platform that increased email personalization from 20% to 95%, leading to a 41% boost in SMS click through rates and a 25% increase in engagement.
Estée Lauder: Partnered with Google Cloud to leverage genAI technologies for real-time consumer feedback monitoring and analyzing consumer sentiment across various channels.
High
Medium
Automated ad campaigns
Automate ad creation, placement, and optimization across various platforms
Showmax: Partnered with AI firms toautomate ad creation and testing, reducing production time by 70% while streamlining their quality assurance process.
Headway: Employed AI tools for ad creation and optimization, boosting performance by 40% and reaching 3.3 billion impressions while incorporating AI-generated content in 20% of their paid campaigns.
High
High
Brand sentiment tracking
Monitor and analyze public opinion about a brand across multiple channels in real time
L’Oréal: Analyzed millions of online comments, images, and videos to identify potential product innovation opportunities, effectively tracking brand sentiment and consumer trends.
Kellogg Company: Used AI to scan trending recipes featuring cereal, leveraging this data to launch targeted social campaigns that capitalize on positive brand sentiment and culinary trends.
High
Low
Campaign strategy optimization
Analyze data to predict optimal campaign approaches, channels, and timing
DoorDash: Leveraged Google’s AI-powered Demand Gen tool, which boosted its conversion rate by 15 times and improved cost per action efficiency by 50% compared with previous campaigns.
Kitsch: Employed Meta’s Advantage+ shopping campaigns with AI-powered tools to optimize campaigns, identifying and delivering top-performing ads to high-value consumers.
High
High
Content strategy
Generate content ideas, predict performance, and optimize distribution strategies
JPMorgan Chase: Collaborated with Persado to develop LLMs for marketing copy, achieving up to 450% higher clickthrough rates compared with human-written ads in pilot tests.
Hotel Chocolat: Employed genAI for concept development and production of its Velvetiser TV ad, which earned the highest-ever System1 score for adomestic appliance commercial.
High
High
Personalization strategy development
Create tailored messaging and experiences for consumers at scale
Stitch Fix: Uses genAI to help stylists interpret customer feedback and provide product recommendations, effectively personalizing shopping experiences.
Instacart: Uses genAI to offer customers personalized recipes, mealplanning ideas, and shopping lists based on individual preferences and habits.
Medium
Medium
Share article
Url copied to clipboard
No items found.
Subscribe to our Newsletter
THANK YOU FOR YOUR SUBSCRIPTION
Oops! Something went wrong while submitting the form.
Questions? We have answers
What is walled garden reporting?
Walled garden reporting refers to campaign performance metrics generated and controlled by closed advertising platforms such as Google, Meta, and Amazon. These platforms measure and report on campaign outcomes using their own proprietary tools, attribution models, and data. While useful for optimizing within a single platform, walled garden reporting does not provide a neutral or unified view of performance across the broader marketing mix.
Why can platform-reported performance be misleading?
Each platform uses its own attribution model, which is designed to measure — and often maximize credit for — conversions that occur within its ecosystem. When an advertiser aggregates reports from multiple platforms, the total conversions claimed will frequently exceed the actual number of conversions. This overlapping attribution, combined with inconsistent measurement definitions and non-interoperable data, can create an inflated and fragmented picture of campaign performance.
How can brands measure campaigns across multiple platforms?
Brands can build independent measurement by consolidating data from multiple platforms into a centralized analytics environment, applying consistent cross-platform attribution models, and using privacy-safe collaboration tools like data clean rooms. Specialized cross-channel reporting platforms can also integrate data from multiple sources and provide unified performance dashboards that are not tied to any single platform's ecosystem.
What are alternatives to walled garden measurement?
The primary alternatives to walled garden measurement include independent analytics frameworks built on centralized data warehouses, data clean rooms for privacy-safe cross-party analysis, cross-channel reporting platforms that aggregate and normalize multi-platform data, and governance frameworks that standardize measurement definitions and attribution logic across the entire media mix.
What tools help build cross-channel visibility?
Tools that support cross-channel visibility include centralized data platforms (such as BigQuery or Snowflake), cross-channel reporting and optimization platforms (such as Elevate), data clean room solutions (such as those offered by LiveRamp, Snowflake, or Amazon Marketing Cloud), and industry measurement frameworks developed by organizations like the IAB. The most effective approach typically combines several of these tools within a structured governance framework that ensures consistency and accountability.
Have other questions?
If you have more questions, contact us so we can help.

.svg)
.svg)