Cross-Channel Marketing Measurement: Challenges and Solutions
August 12, 2026
15
minutes read
Every platform you buy from grades its own work, and every one of them awards itself top marks. This article unpacks why those flattering reports add up to a distorted view of performance, and how cross-channel marketing measurement gives marketers one honest picture of what their money actually buys across the channels they run.
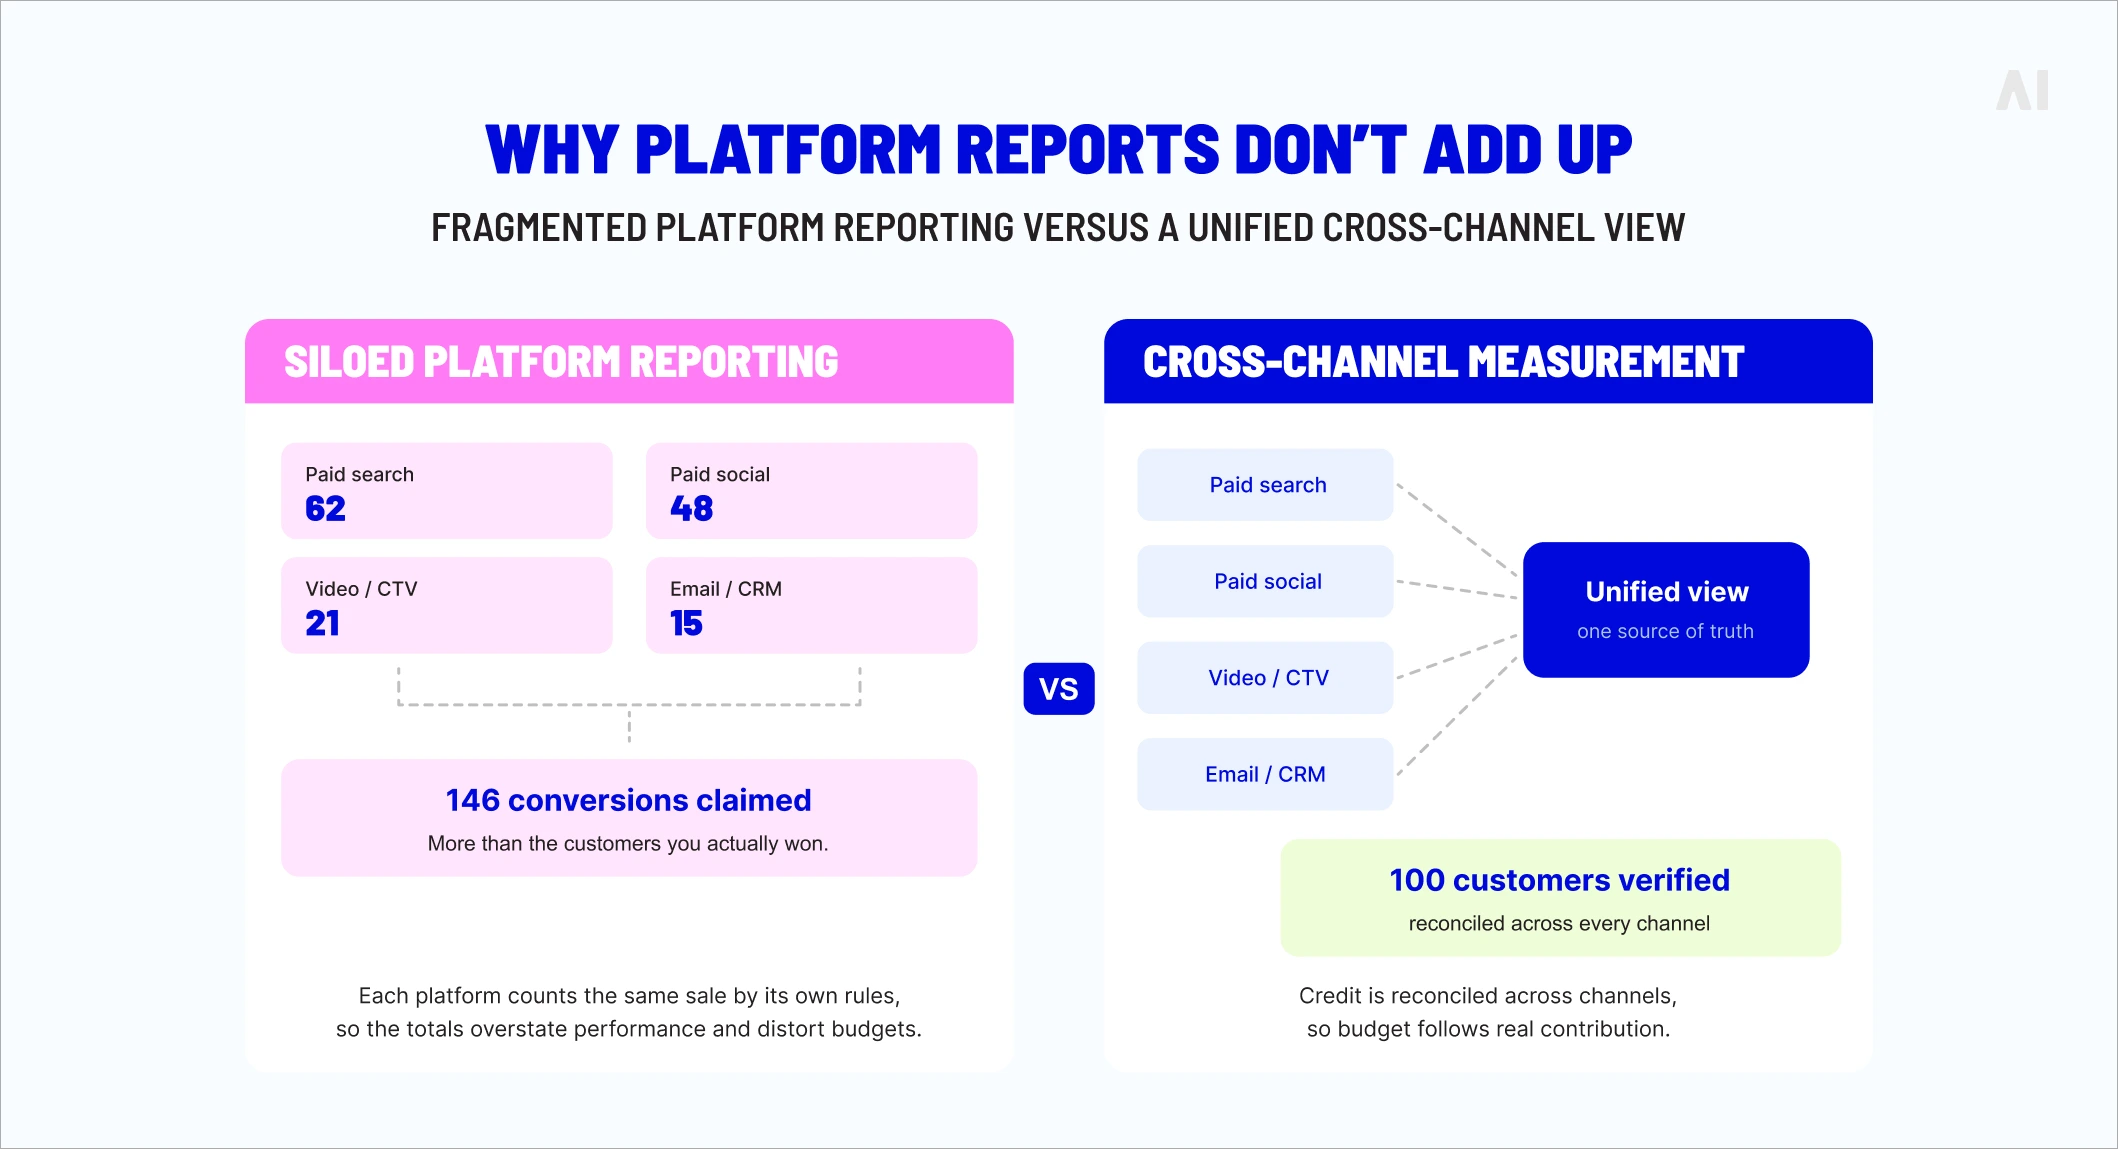
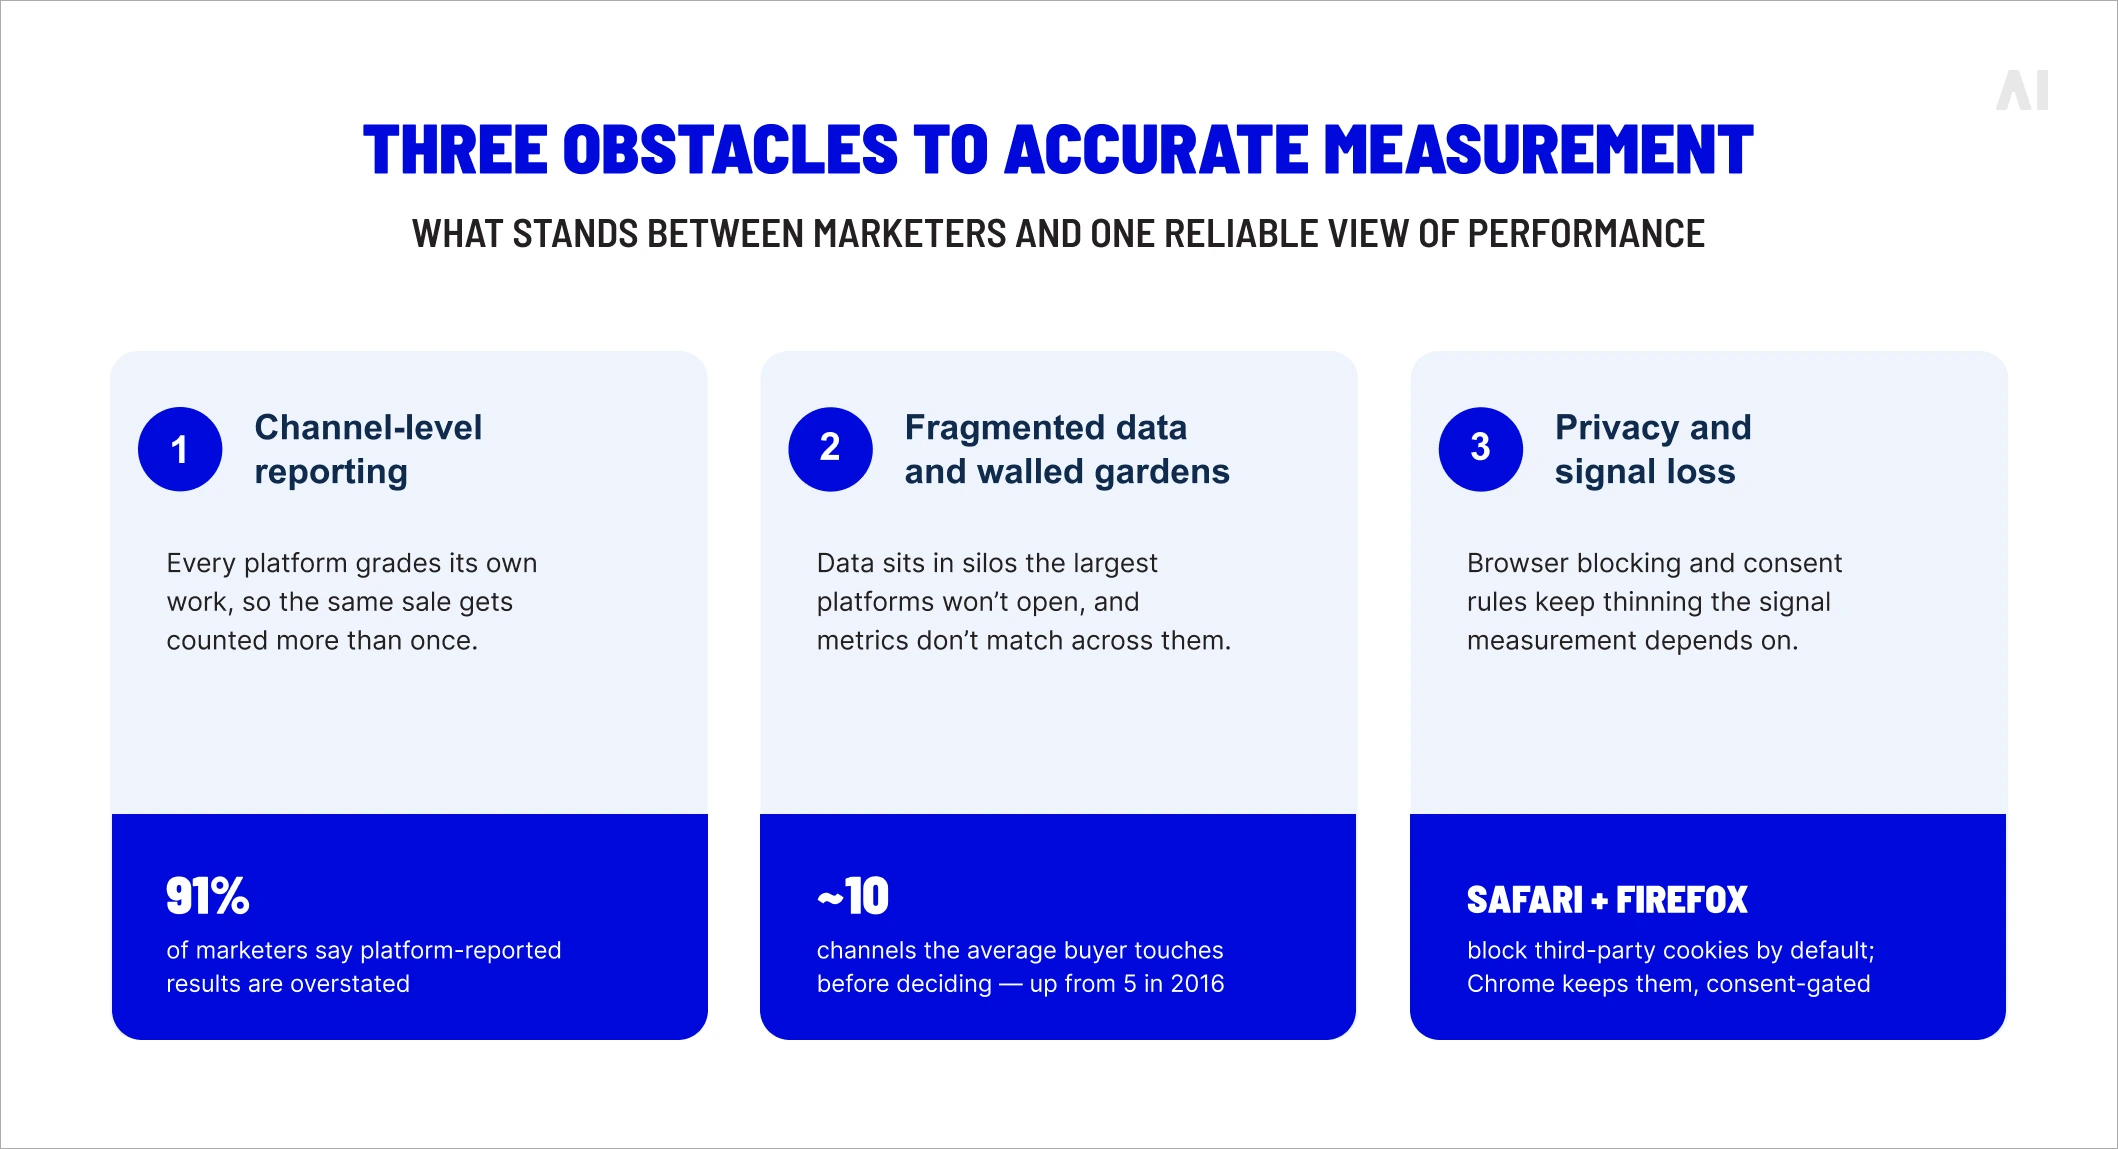
Ask Google, Meta, TikTok, and your email tool how a campaign did, and each hands back a number built to please. Stack those numbers together and you appear to have won more customers than you actually have. That gap — between what platforms claim and what the business earned — is where budgets leak, and it runs deeper than most teams suspect. In a March 2026 survey of senior brand and agency marketers, 91% said platform-reported results are overstated, and four in five admitted they optimize without verified purchase data to check them against.
That overstatement has a price. When every channel marks its own homework, assist channels go undervalued, acquisition costs are figured from inflated numbers, and money chases whichever platform shouts loudest rather than whichever does the work. Three pressures have brought the problem to a head: buying now spreads across morechannelsand devices than any one report can follow; privacy rules and browser restrictions have thinned the data that once connected those touchpoints; and the biggest platforms keep their measurement behind their own walls. Cross-channel marketing measurement answers all three.
What follows
defines the discipline and separates it from the terms it gets confused with,
lays out the benefits of measuring across channels instead of within them,
works through the three obstacles in the way — channel-level reporting, data fragmentation, and privacy restrictions — and then
turns to the fixes, from unified reporting and independent attribution to privacy-safe technology.
By the end you should be able to judge where your own measurement stands and what to build next.
Pic. Why platform reports don't add up.
What is cross-channel marketing measurement?
Cross-channel marketing measurement evaluates performance across every channel a brand runs — paid search, social, display, video, email — through one consistent view of how customers move toward a conversion. Instead of reading each platform's self-report in isolation, it stitches the interactions together so credit, cost, and contribution can be judged on the same terms.
That single view earns its keep four ways.
It makes attribution honest, tracing a conversion across the touchpoints that shaped it rather than handing the whole prize to the last click.
It maps the customer journey, showing how people travel between channels before they buy.
It counts real reach instead of paying for the same person several times over.
And it gives budgets a common yardstick, so spend can follow genuine contribution.
The two comparisons below clear up where the discipline ends and its neighbors begin.
Cross-channel vs cross-media measurement
The terms get used as synonyms, but they cover different ground.
Cross-channel measurement concerns digital channels and the interactions a brand can observe inside them — the clicks, views, and conversions flowing through search, social, display, and email.
Cross-media measurement reaches wider, setting digital beside traditional media like linear TV, radio, print, and out-of-home to gauge their combined effect on reach and sales.
The split comes down to scope and data.
A performance marketer tuning digital spend week to week needs cross-channel measurement, because the decisions are granular and the data is observable.
A brand planning a national push across streaming, linear TV, and digital needs cross-media, which leans on modeling to weigh media that can't be tracked alike.
Most organizations run both: cross-channel for daily optimization, cross-media above it for strategy.
Cross-channel vs omnichannel measurement
Cross-channel measurement asks how marketing performs across channels.Omnichannel measurement asks how the customer experiences a brand across touchpoints — whether they can move from app to store to call center without friction or repetition. One judges the effectiveness of media; the other the coherence of the journey.
They feed each other.
A strong omnichannel experience produces cleaner, better-connected data, which sharpens cross-channel measurement.
Accurate cross-channel measurement, in return, exposes where the experience breaks and which combinations of touchpoints actually push people to buy.
Blur the two and the metrics turn to mush; treat them as partners and a brand improves both what it spends and how it shows up.
Benefits of cross-channel marketing measurement
Measuring across channels rather than reading dashboards in isolation lifts the quality of almost every call a team makes. The four below have the shortest line to the bottom line: sharper attribution, smarter budgets, a clearer journey, and less waste.
More accurate attribution
Single-platform reporting credits what it can see, which is usually the final click in its own backyard. Cross-channel measurement follows the whole path, so the display impression that built awareness, the social touch that sparked interest, and the search click that sealed the deal each get their share. The bias toward bottom-of-funnel channels fades, and upper-funnel work stops being cut just because it never lands the last click.
Value the assists correctly and the channels that create demand keep their funding — so the pipeline they feed doesn't dry up a quarter later for reasons no one can trace.
Better budget allocation
A unified view shows which channels move the business and which only look like they do. It catches diminishing returns — the point where the next dollar buys less than the last — and unmasks channels that flatter their own dashboard but add little once duplication is stripped out. Budget can then track contribution instead of a platform's confidence in itself.
Move spend from over-credited channels to genuinely incremental ones and returns improve on the same budget — the kind of result a finance team signs off on.
Improved customer journey visibility
Modern purchases wander. McKinsey's B2B Pulse research found buyers now use an average of ten interaction channels before deciding, up from five in 2016 — double in under a decade, and that's before the channels a brand can't control. Cross-channel measurement shows how people really move between them, which sequences convert, and where journeys stall.
That turns optimization from hunch into evidence. Rather than asking whether a channel "works," a team sees how it works alongside the others, and builds sequences that carry people to a purchase with less friction.
Reduced media waste
Measuring across channels drags the inefficiencies that channel-level reporting hides into the light — audience overlap, runaway frequency, placements that eat budget and return nothing. A unified view lets a team see the duplication instead of guessing at it.
The waste that surfaces most often:
Audience overlap, where the same people are reached and paid for across several channels for no added effect.
Frequency saturation, where ads hit one person so often that each extra impression only adds cost.
Underperforming placements, where inventory swallows budget without measurable lift.
Misattributed channels, where spend scales on credit a channel never earned.
Caught early, all four are recoverable. Left alone, they drain a media budget all year.
Challenge #1: the limitations of channel-level reporting
Channel-level reporting is the default because it's effortless — every platform serves it up, formatted and confident. The trouble is that it shows one slice as if it were the whole pie, and the slices refuse to add up. Fragmented data, overlapping attribution, and metrics each platform defines its own way combine to produce conclusions that feel data-driven and aren't.
⚡ No platform is a neutral witness to its own success. Ask each one how it did, and they all claim the same sale.
The cost of disconnected channels
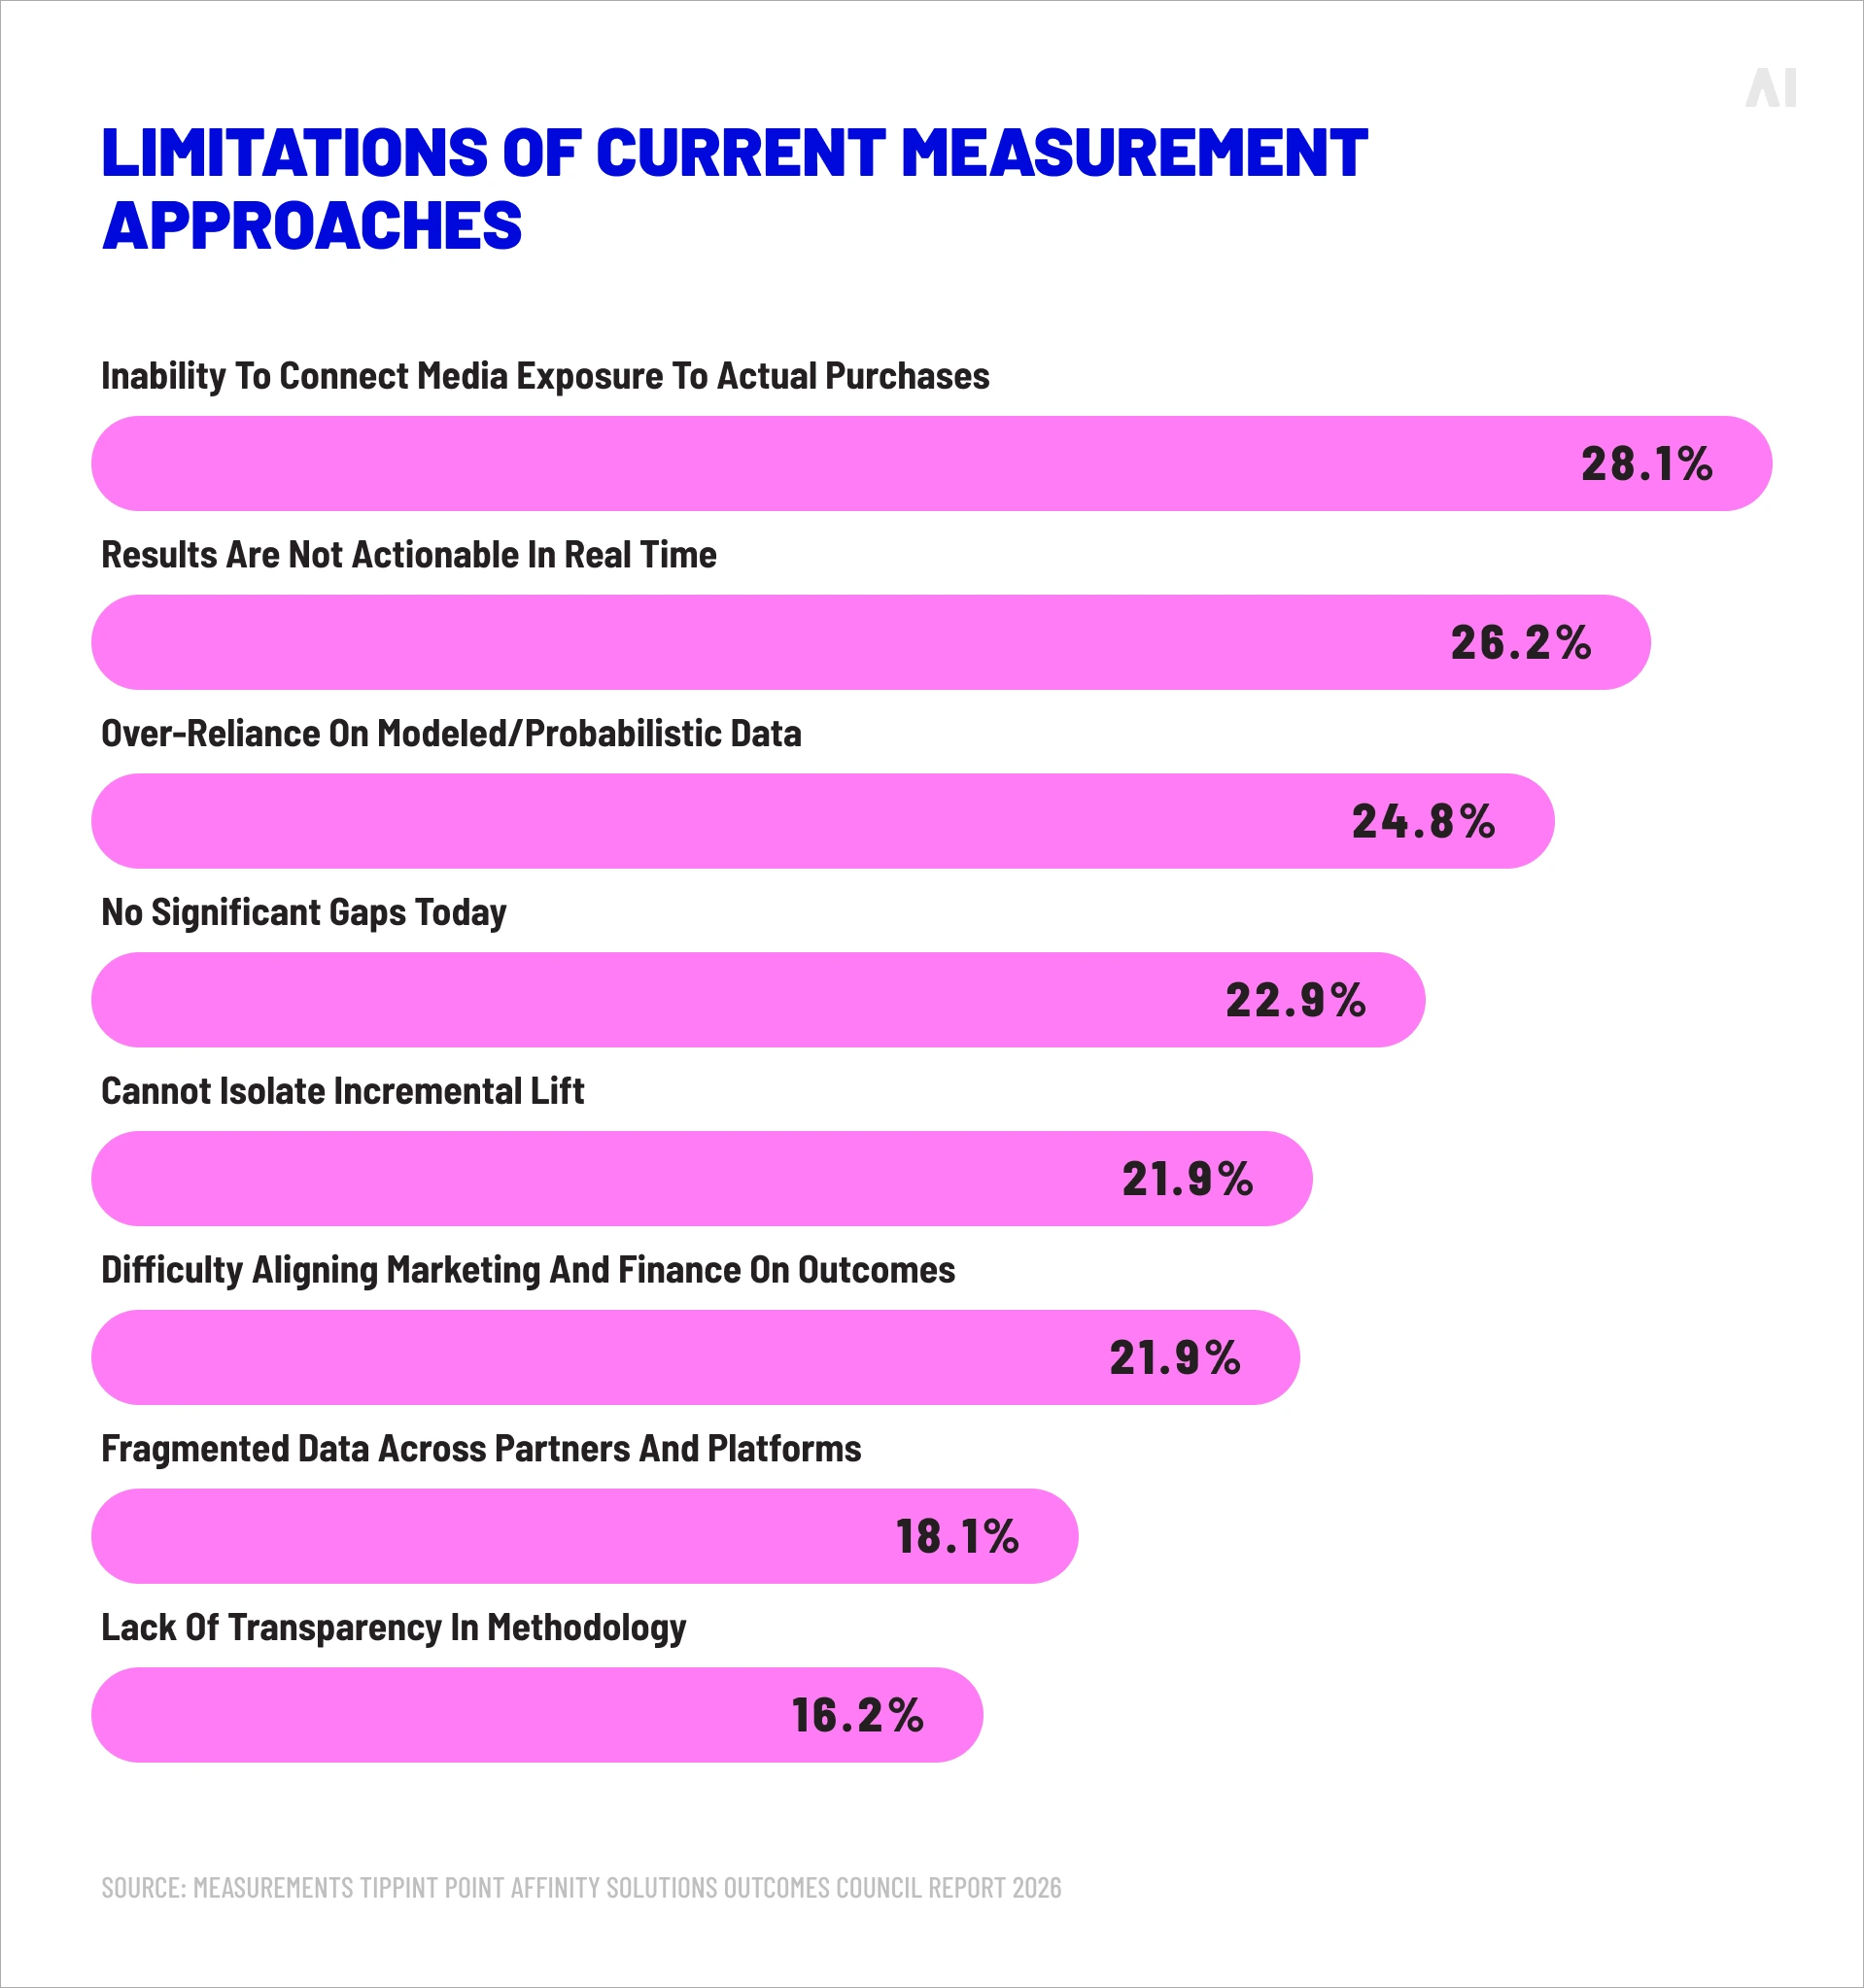
Disconnected measurement costs real money. Budgets are set against numbers that overstate, so spend goes to the wrong places. Assist channels that build demand get cut. Acquisition cost, figured from inflated conversions, looks lower than it is and invites overspending. The same March 2026 survey found more than two-thirds of marketers estimate at least 11% of their media budget is lost to the lag and disconnection between measurement and real outcomes, with a third putting it above a quarter of spend.
At the scale most brands operate, a tenth of the media budget is the margin between a profitable program and a break-even one. Disconnected measurement is what keeps that loss out of sight.
Pic. Limitations of current measurement approaches (Source).
Challenge #2: data fragmentation and walled garden limitations
Even a team set on measuring across channels hits structural walls. Data sits in incompatible silos, the biggest platforms ration what leaves their environment, metrics are defined inconsistently, and the journey scatters across services that won't share or match data. These are the obstacles that make one reliable view so hard to build.
Identity resolution challenges
The major platforms hoard detailed user-level data and release almost none of it. Inside a walled garden, an advertiser sees aggregated reports but not the signals that would let it recognize the same customer elsewhere. Linking an interaction on one platform to a purchase that closes on another depends on identity resolution — matching scattered signals to one person — and that gets harder as user-level data is locked away or stripped of identifiers.
Limited platform data access
Restricted access to campaign and audience data leaves gaps a brand can't close alone. When a platform shares only summaries and withholds the granular data beneath them, there's no way to verify its performance independently or fold the channel cleanly into a cross-channel model. The gaps aren't random — they fall exactly where outside scrutiny would help most.
Inconsistent channel metrics
Channels resist direct comparison because they define their terms differently. A "view" might mean two seconds on one platform and a completed play on another. An "engagement" might be a click, a swipe, or a pause. Without standard definitions, putting two channels side by side compares things that only look alike — which is why a measurement framework has to fix the definitions before any comparison can be trusted.
Attribution windows and double counting
Platforms also disagree about time. One credits a click within thirty days; another a view within seven. When the same purchase falls inside both windows, both claim it, and the duplication pours straight into any analysis that trusts the figures. Reconciling windows to a common standard is among the least glamorous and most necessary jobs in cross-channel measurement.
Platform-controlled attribution
Because each platform supplies its own attribution method, the rules are written by the party with the most to gain from a good grade. Different methods reach different verdicts on the same campaign, so comparing two platforms often means comparing two incompatible accounting systems. The inconsistency isn't a bug anyone is rushing to fix — it's what you get when every channel scores itself.
Fragmented customer journey visibility
The journey scatters across environments that can't easily share data, and more of it now happens where no advertiser can see it. Gartner's 2026 research found a substantial share of buyers now use AI assistants during a purchase, researching through tools like ChatGPT, Perplexity, and AI-generated search summaries long before they reach a trackable page. The journey lengthens while the visible part shrinks — so upper-funnel work looks weaker than it is and gets cut for the wrong reasons.
Challenge #3: privacy and data-collection restrictions
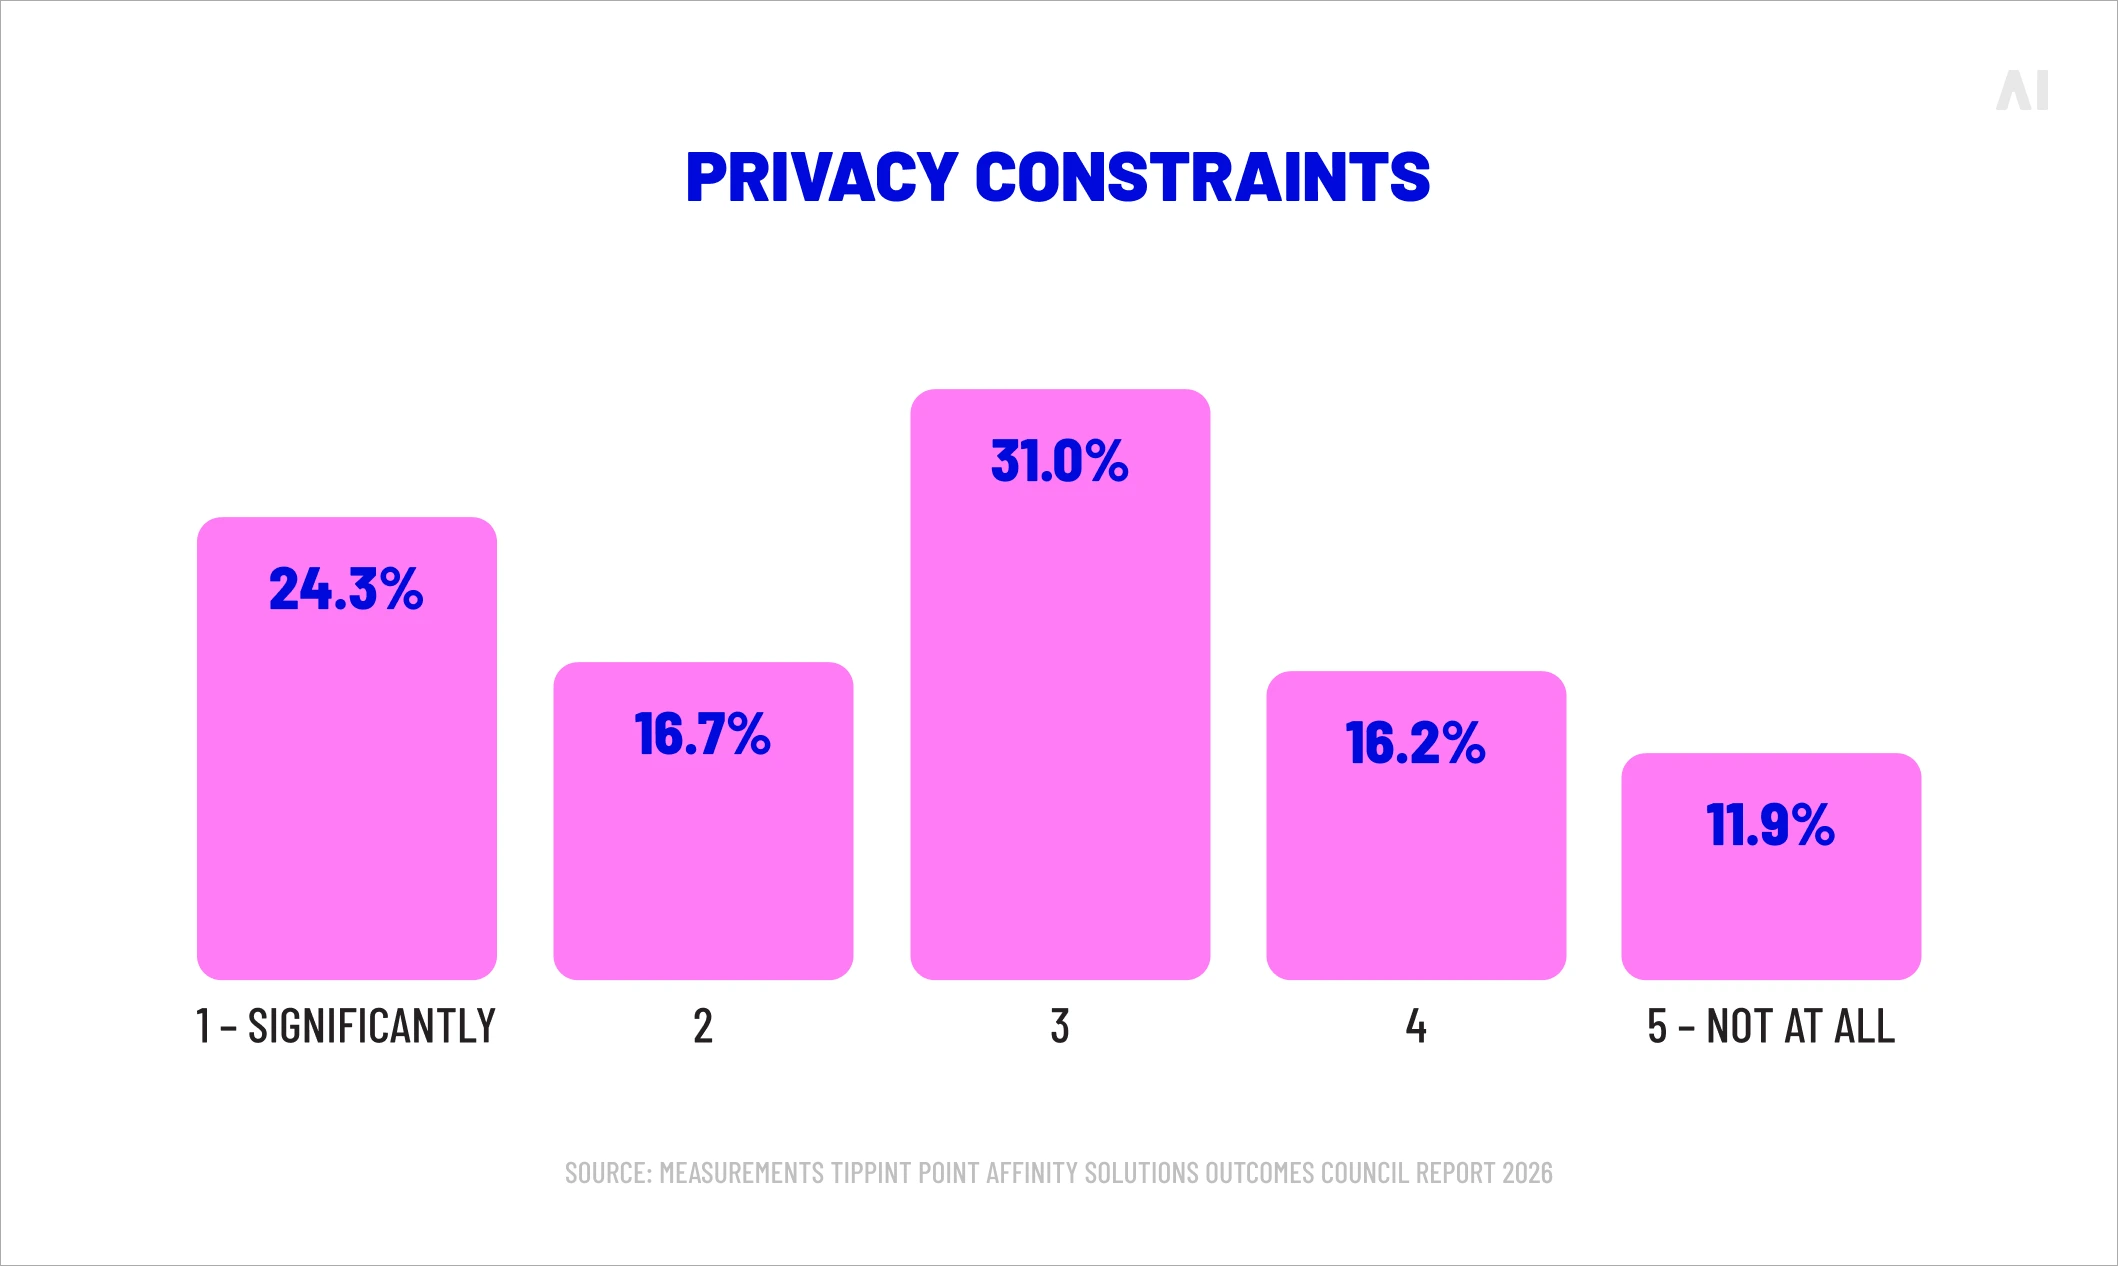
Privacy regulation, browser policy, and changing collection norms have stripped out much of the signal cross-channel measurement once leaned on. The job now is to hold onto accuracy and visibility while staying compliant — without clinging to the outdated belief that third-party cookies are about to vanish overnight.
The much-predicted death of the third-party cookie never arrived on schedule. After years of delay, Google abandoned its plan to deprecate cookies in Chrome, dropped the idea of a standalone consent prompt in 2025, and wound down most of its Privacy Sandbox initiative in October 2025. Third-party cookies remain in Chrome with no removal date. The cookie survived; the promise of a single Google-built replacement for it did not.
A clean cutover would have been easier to plan around. Instead, cookies persist in Chrome while Safari and Firefox block them by default across a large share of traffic, and consent rules limit their use everywhere. Signal erodes steadily rather than vanishing at once, and the durable answer is to lean on data a brand owns outright — modeled signals, server-side collection, first-party relationships — rather than wait for an identifier that isn't coming.
Server-side tracking lifts measurement off the browser and into a brand's own environment, out of reach of browser blocking and ad blockers. Pair it with a deliberate first-party data strategy — data drawn straight from a brand's sites, apps, and customer relationships — and you get higher-quality, more durable signal than third-party identifiers ever delivered. It won't restore perfect tracking, but it rebuilds a reliable core to anchor measurement to.
Consent management and data collection
None of it works without consent done right. The GDPR and the widening patchwork of US state privacy laws apply whatever the cookie's status, so transparent collection and clear consent are now fixed features of any measurement program, not a compliance afterthought. Done well, consent does more than satisfy the law — it earns the trust that improves the first-party data a brand collects.
Pic. Three obstacles to accurate measurement.
Solution #1: improving reporting visibility
The first set of fixes takes on fragmentation head-on: connecting data across channels, loosening dependence on any single platform's reporting, validating performance independently, and cleaning the supply paths that feed measurement. Together they trade a stack of conflicting dashboards for something close to a single source of truth.
Building a unified view across platforms
A unified view starts by connecting the data a brand already holds — planning, activation, measurement, reporting — so performance reads consistently across channels instead of being rebuilt by hand each week. Data integration platforms, customer data platforms, and marketing intelligence solutions all cut fragmentation by standardizing how information is gathered and compared. AI Digital's Elevate does this as a marketing intelligence platform, pulling research, planning, and performance insight into one intelligence layer so the numbers a team plans against and the numbers it reports on come from the same source.
The dashboard is only the surface. What holds is the consistency beneath it — every channel measured on common terms, so the comparisons and the budget calls that follow rest on solid ground.
Using DSP-agnostic measurement approaches
Cutting dependence on any one platform comes next. DSP-agnostic execution lets a marketer work across many demand-side platforms instead of being locked to one environment's tools and one environment's reporting, which lifts transparency and widens access to cross-channel data. AI Digital's Open Garden framework is built on that principle, giving advertisers a neutral, transparent way to measure across platforms without trusting any single platform's account of itself.
Improving measurement through independent reporting
Independent reporting exists to check the platforms, not take their word. By validating platform-reported performance against a neutral source, comparing channels on consistent terms, and giving optimization a dependable base, it turns a pile of self-interested reports into something a budget can stand on. As AI-driven buying tools take over more of execution, the case for an independent layer to validate what those tools report only gets stronger.
⚡ Independent measurement gives a brand one number it can trust — produced by a party with nothing to gain from the answer.
Strengthening attribution with supply path transparency
Measurement is only as good as the data feeding it, and a noisy, opaque supply path feeds it noise. Supply path optimization and curated inventory raise the quality of the signals reaching a measurement system by thinning the chain of intermediaries and the murk they add. AI Digital's Smart Supplyis a supply-side curation tool, not a measurement product — but cleaner, more transparent supply has a direct downstream effect: when the inventory is curated and the path to it is clear, the data used to measure that buying carries less noise and supports more reliable attribution.
Solution #2: improving attribution accuracy
Connecting and validating data solves visibility. Measuring contribution accurately is a separate craft, and no single method nails it. The approaches below — rules-based and data-driven attribution, MMM, MTA, incrementality testing, and unified measurement — each answer a different question, and the payoff is in combining them.
Rules-based vs data-driven attribution
Rules-based attribution hands out credit by a fixed formula — all to the last click, or split evenly, or weighted to first and last touch. Easy to grasp, easy to misapply, because the marketer picks the rule rather than discovering it in the data.
Data-driven attribution instead uses machine learning to weight touchpoints by their observed influence on conversions, which is why Google made data-driven attribution the default in GA4 and retired most rules-based models as standalone options. Data-driven models win where there's enough clean data to train them and falter where there isn't, so the choice rides on a brand's data maturity as much as its ambition.
MMM vs MTA
MMM and MTA work the same problem from opposite ends.
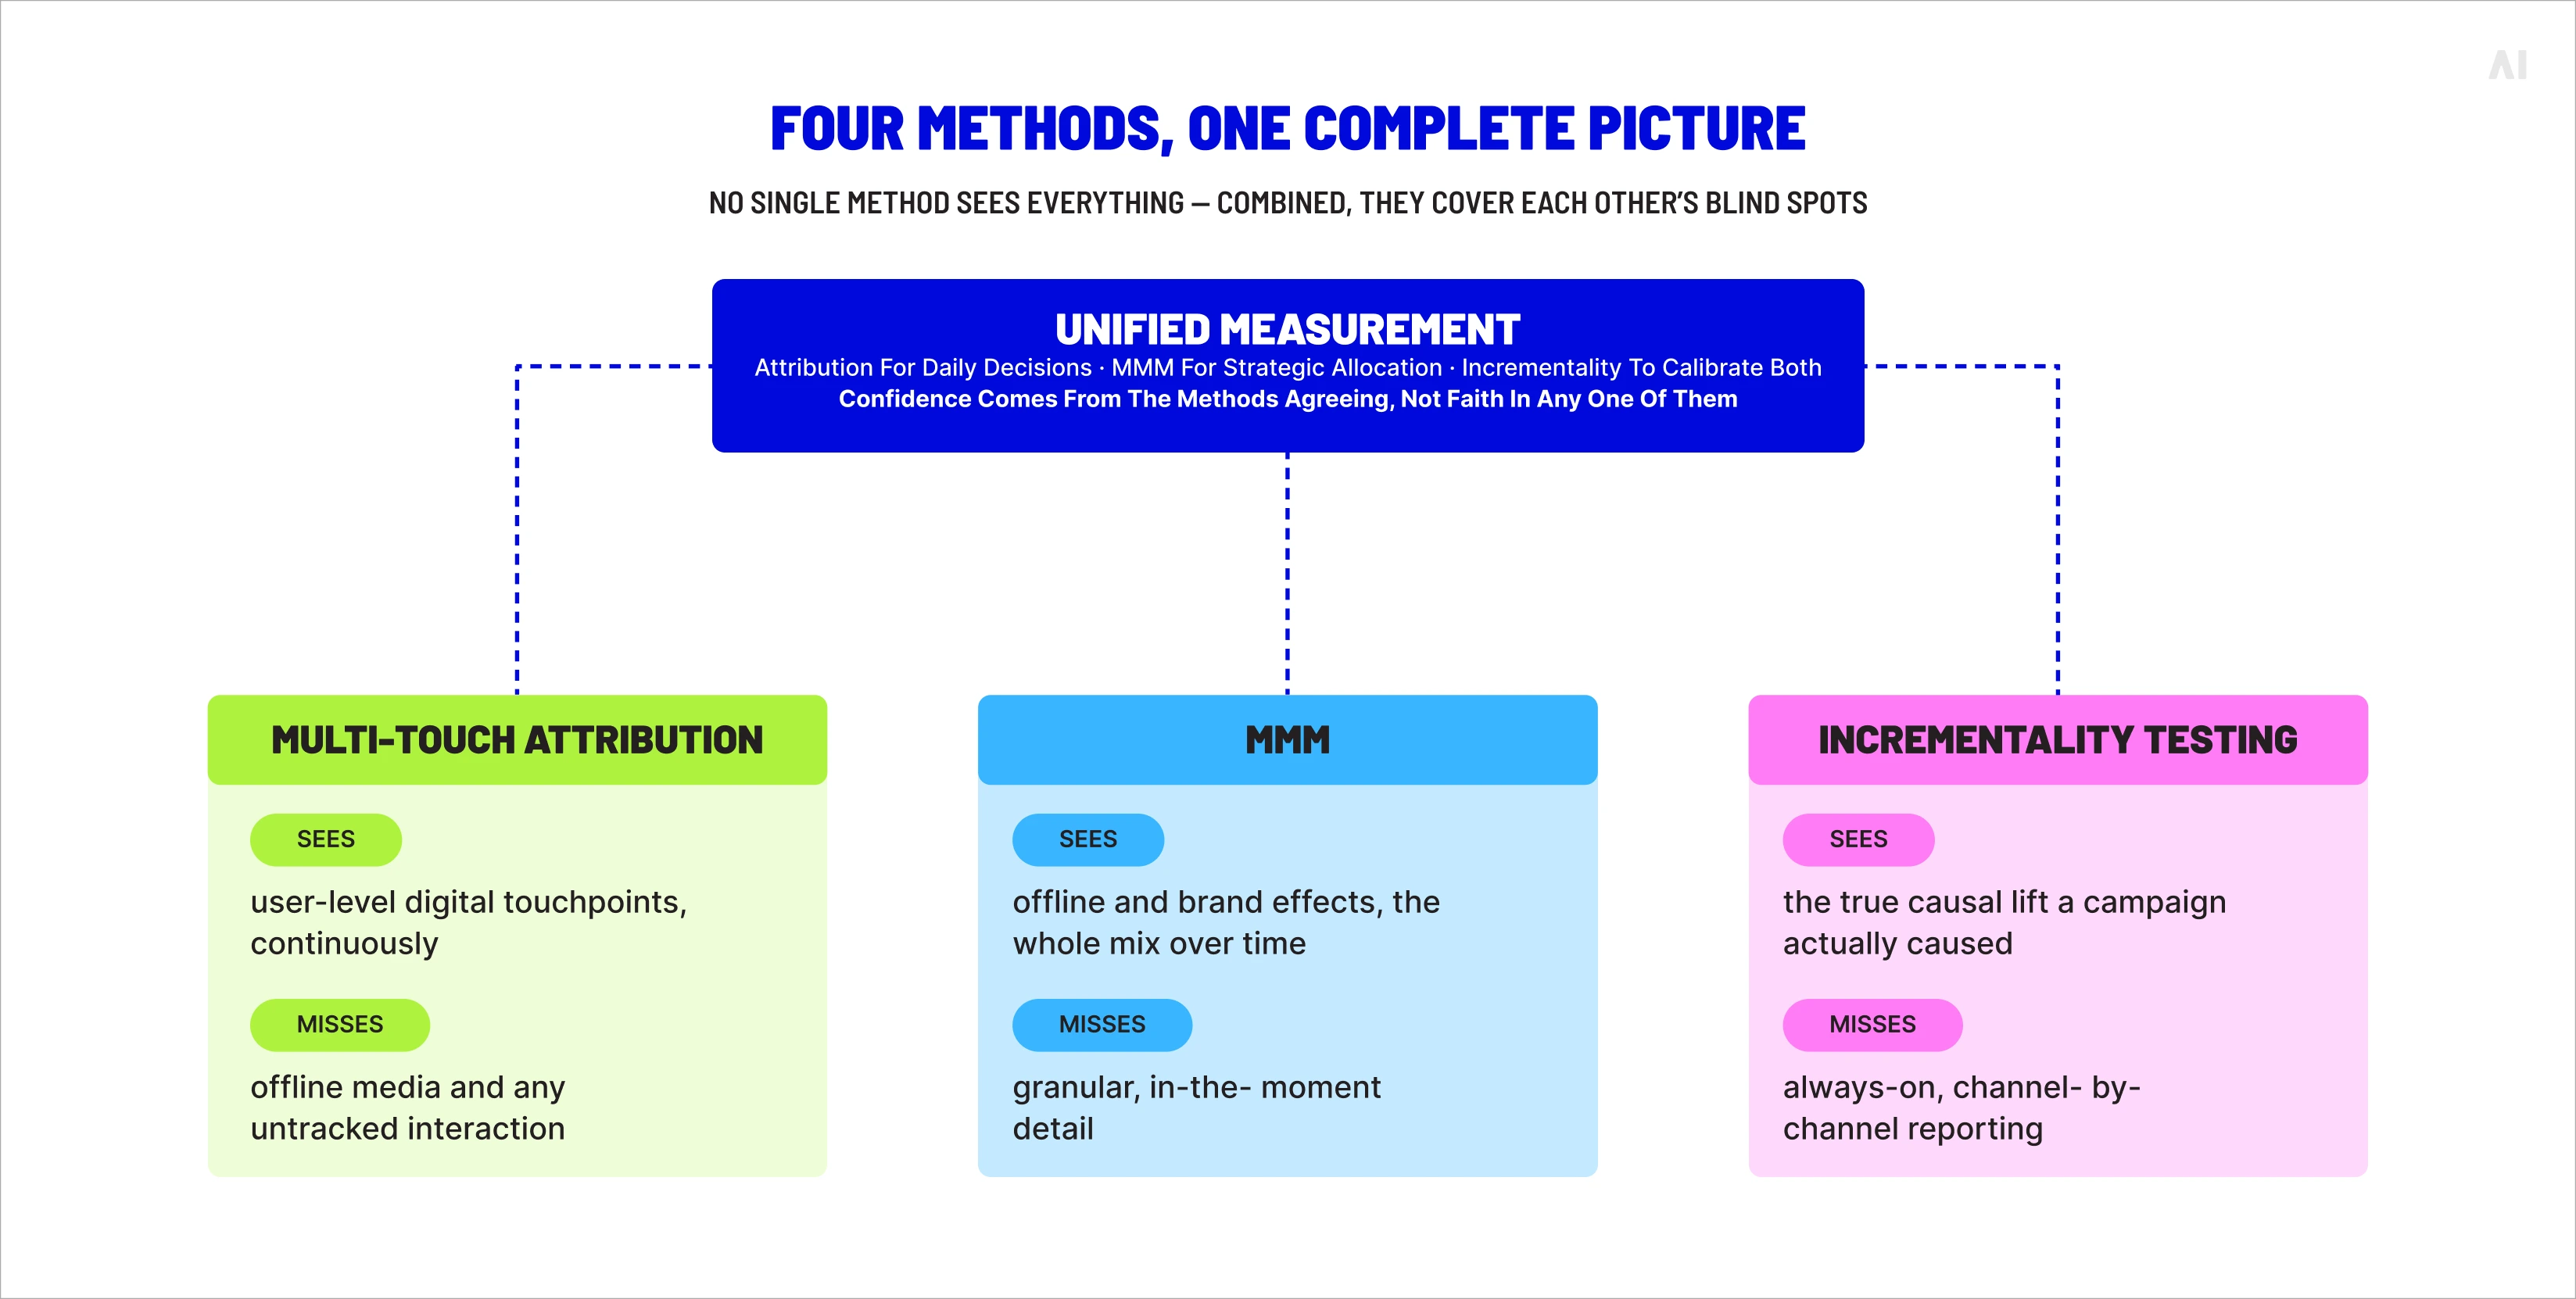
MTA runs bottom-up off user-level digital events: granular and continuous, but blind to offline media and anything it can't track.
MMM runs top-down off aggregated, time-series data: resistant to signal loss and able to see offline and brand effects, but slower and coarser.
Neither is a complete system, and mistaking either for one is how budgets end up in the wrong places.
Incrementality testing
Incrementality testing answers the one question attribution can't: would the conversion have happened anyway? Through holdout groups, geo experiments, and matched-market designs, it isolates the lift a campaign genuinely caused from the credit it merely banked in a reporting pipeline. It's the closest thing the field has to a causal check, and it's how attribution's findings get proven instead of assumed.
Unified measurement approaches
Since every method has a blind spot, mature teams rarely bet on one. Gartner's long-standing advice is to combine them — attribution, MMM, and experimentation — and use each where it's strongest rather than force one model to do everything. A unified approach runs them in concert: attribution for tactical, day-to-day calls; MMM for strategic allocation; incrementality to calibrate both. Elevate's measurement capabilities, including its MMM and path-to-conversion modeling, bring these methods into one view, so confidence comes from the methods agreeing rather than faith in any single one.
Online-to-offline measurement
Much of what marketing influences happens off-screen — a store visit, a phone call, a purchase logged in a CRM weeks later. Tying digital activity to those offline outcomes is what makes a cross-channel view complete rather than merely digital. Customer data platforms, analytics tools, and footfall measurement connect online exposure to offline behavior, so a channel's pull on in-store sales or inbound calls gets counted instead of ignored.
Pic. Four methods, one complete picture.
Building effective cross-channel measurement
Accurate cross-channel measurement rests on a handful of practical capabilities: connected data, protected privacy, a strong first-party foundation, and disciplined standards. The four below are the blocks a brand stacks to make everything above possible.
Connect data with CDPs
A customer data platformunifies first-party data into a single profile — the backbone of cross-channel measurement. The three tools people conflate here deserve separating:
a CDP centers on an organization's own first-party data and builds a unified customer view;
a DMP handles broader first-, second-, and third-party data for targeting;
a clean room matches data between parties without exposing raw records.
Mix them up and you buy the wrong tool for the job. The CDP's role is identity resolution and a connected view of the journey.
Protect privacy with clean rooms
Clean rooms let two parties match and analyze data without either seeing the other's raw records, which makes them increasingly central as third-party identifiers fade. Retail media is pulling that growth along: US retail media is closing on $70 billion in 2026, yet fewer than half of US retail media networks offer clean-room capabilities — a wide gap between demand for privacy-safe measurement and the infrastructure to deliver it. A clean room returns answers, not records, and works best as one part of a measurement framework rather than the whole of it.
Strengthen measurement with first-party data
First-party data is the connective tissue of cross-channel measurement. Because it comes straight from a brand's own customer interactions, it links touchpoints across channels, sharpens attribution, and holds up in a privacy-first world where third-party signals buckle. The brands measuring most accurately tend to be the ones that invested early in collecting and organizing their own data.
Standardize data with UTM governance
The least technical capability often decides whether the rest functions. Consistent tracking standards — naming conventions, tagging discipline, governed UTM parameters — determine whether data from different channels can be compared at all. Skip them and cross-channel reporting falls apart before it starts. A workable standard covers:
Naming conventions documented, enforced, and applied the same way by every team.
UTM parameters structured consistently across campaigns, channels, and regions.
Tagging discipline audited rather than assumed, so errors get caught before they pollute reporting.
Ownership, with a named team keeping the standard current as channels and campaigns change.
Unglamorous work, but a reliable measurement program is built on it.
How cross-channel measurement improves marketing performance
Measurement only counts when it changes decisions. A unified view of contribution, journeys, and campaign effectiveness lets a team move budget toward what works, cut the waste channel-level reporting hides, and defend marketing investment with numbers instead of assertion. That last point carries more weight every year: as spend comes under sharper scrutiny, tying it to outcomes has become a basic expectation, not a bonus.
Deloitte's 2026 Digital Marketing Trends research found only a third of enterprises set clear KPI targets for marketing ROI, even as budgets face CFO-level examination. Cross-channel measurement closes that gap with numbers a team can stand behind — which campaigns drove revenue, which channels build the demand others capture, where the next dollar is best spent. The brands that measure deliberately make better calls, waste less, and earn a stronger seat at the table.
The path forward for cross-channel marketing measurement
The obstacles to accurate cross-channel marketing measurement are clear and familiar.
Channel-level reporting shows a fraction and calls it the whole.
Data fragmentation and walled gardens keep the pieces from connecting.
Privacy restrictions have thinned the signal that linked them.
And platform-controlled attribution leaves each channel to grade itself.
None of this eases on its own — the advertising environment will keep adding channels, formats, and rules.
The fixes are just as clear:
A unified view, built on connected data and a marketing intelligence layer, replaces conflicting dashboards with a single source of truth.
DSP-agnostic execution and independent reporting loosen reliance on any one platform's account of itself.
First-party data, server-side collection, and clean rooms rebuild reliable signal in a privacy-first world.
And combining attribution, MMM, and incrementality produces a result a team can trust because the methods corroborate each other, not because one was believed on faith.
For most teams the next move is to judge honestly where their measurement stands, fix the most damaging gaps first, and build toward something that scales.
⚡ Measured platform by platform, performance is a story each channel tells about itself. Measured across channels, it becomes something the business can act on.
This is the work AI Digital does with brands and agencies: managed media services, supply-side curation through Smart Supply, DSP-agnostic execution through the Open Garden framework, and unified intelligence through Elevate. If you're moving from fragmented, platform-dependent reporting toward a measurement approach you can trust, get in touch with our team to talk through where to start.
Blind spot
Key issues
Business impact
AI Digital solution
Lack of transparency in AI models
• Platforms own AI models and train on proprietary data • Brands have little visibility into decision-making • "Walled gardens" restrict data access
• Inefficient ad spend • Limited strategic control • Eroded consumer trust • Potential budget mismanagement
Open Garden framework providing: • Complete transparency • DSP-agnostic execution • Cross-platform data & insights
Optimizing ads vs. optimizing impact
• AI excels at short-term metrics but may struggle with brand building • Consumers can detect AI-generated content • Efficiency might come at cost of authenticity
• Short-term gains at expense of brand health • Potential loss of authentic connection • Reduced effectiveness in storytelling
Smart Supply offering: • Human oversight of AI recommendations • Custom KPI alignment beyond clicks • Brand-safe inventory verification
The illusion of personalization
• Segment optimization rebranded as personalization • First-party data infrastructure challenges • Personalization vs. surveillance concerns
• Potential mismatch between promise and reality • Privacy concerns affecting consumer trust • Cost barriers for smaller businesses
Elevate platform features: • Real-time AI + human intelligence • First-party data activation • Ethical personalization strategies
AI-Driven efficiency vs. decision-making
• AI shifting from tool to decision-maker • Black box optimization like Google Performance Max • Human oversight limitations
• Strategic control loss • Difficulty questioning AI outputs • Inability to measure granular impact • Potential brand damage from mistakes
Managed Service with: • Human strategists overseeing AI • Custom KPI optimization • Complete campaign transparency
Fig. 1. Summary of AI blind spots in advertising
Dimension
Walled garden advantage
Walled garden limitation
Strategic impact
Audience access
Massive, engaged user bases
Limited visibility beyond platform
Reach without understanding
Data control
Sophisticated targeting tools
Data remains siloed within platform
Fragmented customer view
Measurement
Detailed in-platform metrics
Inconsistent cross-platform standards
Difficult performance comparison
Intelligence
Platform-specific insights
Limited data portability
Restricted strategic learning
Optimization
Powerful automated tools
Black-box algorithms
Reduced marketer control
Fig. 2. Strategic trade-offs in walled garden advertising.
Core issue
Platform priority
Walled garden limitation
Real-world example
Attribution opacity
Claiming maximum credit for conversions
Limited visibility into true conversion paths
Meta and TikTok's conflicting attribution models after iOS privacy updates
Data restrictions
Maintaining proprietary data control
Inability to combine platform data with other sources
Amazon DSP's limitations on detailed performance data exports
Cross-channel blindspots
Keeping advertisers within ecosystem
Fragmented view of customer journey
YouTube/DV360 campaigns lacking integration with non-Google platforms
Black box algorithms
Optimizing for platform revenue
Reduced control over campaign execution
Self-serve platforms using opaque ML models with little advertiser input
Performance reporting
Presenting platform in best light
Discrepancies between platform-reported and independently measured results
Consistently higher performance metrics in platform reports vs. third-party measurement
Fig. 1. The Walled garden misalignment: Platform interests vs. advertiser needs.
Key dimension
Challenge
Strategic imperative
ROAS volatility
Softer returns across digital channels
Shift from soft KPIs to measurable revenue impact
Media planning
Static plans no longer effective
Develop agile, modular approaches adaptable to changing conditions
Brand/performance
Traditional division dissolving
Create full-funnel strategies balancing long-term equity with short-term conversion
Capability
Key features
Benefits
Performance data
Elevate forecasting tool
• Vertical-specific insights • Historical data from past economic turbulence • "Cascade planning" functionality • Real-time adaptation
• Provides agility to adjust campaign strategy based on performance • Shows which media channels work best to drive efficient and effective performance • Confident budget reallocation • Reduces reaction time to market shifts
• Dataset from 10,000+ campaigns • Cuts response time from weeks to minutes
• Reaches people most likely to buy • Avoids wasted impressions and budgets on poor-performing placements • Context-aligned messaging
• 25+ billion bid requests analyzed daily • 18% improvement in working media efficiency • 26% increase in engagement during recessions
Full-funnel accountability
• Links awareness campaigns to lower funnel outcomes • Tests if ads actually drive new business • Measures brand perception changes • "Ask Elevate" AI Chat Assistant
• Upper-funnel to outcome connection • Sentiment shift tracking • Personalized messaging • Helps balance immediate sales vs. long-term brand building
• Natural language data queries • True business impact measurement
Open Garden approach
• Cross-platform and channel planning • Not locked into specific platforms • Unified cross-platform reach • Shows exactly where money is spent
• Reduces complexity across channels • Performance-based ad placement • Rapid budget reallocation • Eliminates platform-specific commitments and provides platform-based optimization and agility
• Coverage across all inventory sources • Provides full visibility into spending • Avoids the inability to pivot across platform as you’re not in a singular platform
Fig. 1. How AI Digital helps during economic uncertainty.
Trend
What it means for marketers
Supply & demand lines are blurring
Platforms from Google (P-Max) to Microsoft are merging optimization and inventory in one opaque box. Expect more bundled “best available” media where the algorithm, not the trader, decides channel and publisher mix.
Walled gardens get taller
Microsoft’s O&O set now spans Bing, Xbox, Outlook, Edge and LinkedIn, which just launched revenue-sharing video programs to lure creators and ad dollars. (Business Insider)
Retail & commerce media shape strategy
Microsoft’s Curate lets retailers and data owners package first-party segments, an echo of Amazon’s and Walmart’s approaches. Agencies must master seller-defined audiences as well as buyer-side tactics.
AI oversight becomes critical
Closed AI bidding means fewer levers for traders. Independent verification, incrementality testing and commercial guardrails rise in importance.
Fig. 1. Platform trends and their implications.
Metric
Connected TV (CTV)
Linear TV
Video Completion Rate
94.5%
70%
Purchase Rate After Ad
23%
12%
Ad Attention Rate
57% (prefer CTV ads)
54.5%
Viewer Reach (U.S.)
85% of households
228 million viewers
Retail Media Trends 2025
Access Complete consumer behaviour analyses and competitor benchmarks.
Identify and categorize audience groups based on behaviors, preferences, and characteristics
Michaels Stores: Implemented a genAI platform that increased email personalization from 20% to 95%, leading to a 41% boost in SMS click through rates and a 25% increase in engagement.
Estée Lauder: Partnered with Google Cloud to leverage genAI technologies for real-time consumer feedback monitoring and analyzing consumer sentiment across various channels.
High
Medium
Automated ad campaigns
Automate ad creation, placement, and optimization across various platforms
Showmax: Partnered with AI firms toautomate ad creation and testing, reducing production time by 70% while streamlining their quality assurance process.
Headway: Employed AI tools for ad creation and optimization, boosting performance by 40% and reaching 3.3 billion impressions while incorporating AI-generated content in 20% of their paid campaigns.
High
High
Brand sentiment tracking
Monitor and analyze public opinion about a brand across multiple channels in real time
L’Oréal: Analyzed millions of online comments, images, and videos to identify potential product innovation opportunities, effectively tracking brand sentiment and consumer trends.
Kellogg Company: Used AI to scan trending recipes featuring cereal, leveraging this data to launch targeted social campaigns that capitalize on positive brand sentiment and culinary trends.
High
Low
Campaign strategy optimization
Analyze data to predict optimal campaign approaches, channels, and timing
DoorDash: Leveraged Google’s AI-powered Demand Gen tool, which boosted its conversion rate by 15 times and improved cost per action efficiency by 50% compared with previous campaigns.
Kitsch: Employed Meta’s Advantage+ shopping campaigns with AI-powered tools to optimize campaigns, identifying and delivering top-performing ads to high-value consumers.
High
High
Content strategy
Generate content ideas, predict performance, and optimize distribution strategies
JPMorgan Chase: Collaborated with Persado to develop LLMs for marketing copy, achieving up to 450% higher clickthrough rates compared with human-written ads in pilot tests.
Hotel Chocolat: Employed genAI for concept development and production of its Velvetiser TV ad, which earned the highest-ever System1 score for adomestic appliance commercial.
High
High
Personalization strategy development
Create tailored messaging and experiences for consumers at scale
Stitch Fix: Uses genAI to help stylists interpret customer feedback and provide product recommendations, effectively personalizing shopping experiences.
Instacart: Uses genAI to offer customers personalized recipes, mealplanning ideas, and shopping lists based on individual preferences and habits.
Medium
Medium
Share article
Url copied to clipboard
No items found.
Subscribe to our Newsletter
THANK YOU FOR YOUR SUBSCRIPTION
Oops! Something went wrong while submitting the form.
Questions? We have answers
How is cross-channel measurement different from cross-media measurement?
Cross-channel measurement focuses on digital channels and the interactions a brand can observe inside them, which suits day-to-day optimization. Cross-media measurement reaches wider, setting digital beside traditional media like TV, radio, and print, and leans more on modeling to weigh media that can't be tracked alike. Most organizations use cross-channel for tactical decisions and cross-media for strategic planning.
What tools are used for cross-channel measurement?
The core tools are customer data platforms for unifying first-party data, marketing intelligence platforms for connecting planning and reporting, clean rooms for privacy-safe data matching, and a mix of attribution, marketing mix modeling, and incrementality testing for measuring contribution. Most teams run several together rather than one, since each handles a different part of the problem.
What are the biggest challenges in cross-channel measurement?
The main ones are fragmented data spread across incompatible silos, walled gardens that ration user-level data, privacy and browser restrictions that cut available signal, and platform-controlled attribution that lets each channel claim credit by its own rules. Together they make one reliable view hard to build without deliberate effort.
Why is channel-level reporting often inaccurate?
Each platform uses its own attribution window and crediting logic, so the same conversion gets counted by more than one channel. Added up, platform-reported conversions routinely exceed the customers actually won, which inflates performance and distorts budgets. Only a unified view above the individual platforms reconciles the figures back to reality.
How do marketers measure performance across multiple channels?
They connect data from every channel into one consistent view, standardize how metrics and attribution windows are defined, and combine methods — attribution for granular calls, MMM for strategic allocation, incrementality to confirm genuine lift. First-party data and disciplined tracking standards hold the system together.
How can marketers improve cross-channel measurement accuracy?
The highest-impact steps are building a unified data foundation, leaning less on platform-reported figures through independent measurement, investing in first-party data and server-side collection, and using more than one method so confidence comes from the methods agreeing. Consistent tracking governance underpins all of it by making cross-channel data comparable in the first place.
Have other questions?
If you have more questions, contact us so we can help.
Questions? We have answers
This is some text inside of a div block.
Lorem ipsum dolor sit amet, consectetur adipiscing elit. Suspendisse varius enim in eros elementum tristique. Duis cursus, mi quis viverra ornare, eros dolor interdum nulla, ut commodo diam libero vitae erat. Aenean faucibus nibh et justo cursus id rutrum lorem imperdiet. Nunc ut sem vitae risus tristique posuere.
This is some text inside of a div block.
Lorem ipsum dolor sit amet, consectetur adipiscing elit. Suspendisse varius enim in eros elementum tristique. Duis cursus, mi quis viverra ornare, eros dolor interdum nulla, ut commodo diam libero vitae erat. Aenean faucibus nibh et justo cursus id rutrum lorem imperdiet. Nunc ut sem vitae risus tristique posuere.
This is some text inside of a div block.
Lorem ipsum dolor sit amet, consectetur adipiscing elit. Suspendisse varius enim in eros elementum tristique. Duis cursus, mi quis viverra ornare, eros dolor interdum nulla, ut commodo diam libero vitae erat. Aenean faucibus nibh et justo cursus id rutrum lorem imperdiet. Nunc ut sem vitae risus tristique posuere.
This is some text inside of a div block.
Lorem ipsum dolor sit amet, consectetur adipiscing elit. Suspendisse varius enim in eros elementum tristique. Duis cursus, mi quis viverra ornare, eros dolor interdum nulla, ut commodo diam libero vitae erat. Aenean faucibus nibh et justo cursus id rutrum lorem imperdiet. Nunc ut sem vitae risus tristique posuere.
This is some text inside of a div block.
Lorem ipsum dolor sit amet, consectetur adipiscing elit. Suspendisse varius enim in eros elementum tristique. Duis cursus, mi quis viverra ornare, eros dolor interdum nulla, ut commodo diam libero vitae erat. Aenean faucibus nibh et justo cursus id rutrum lorem imperdiet. Nunc ut sem vitae risus tristique posuere.
This is some text inside of a div block.
Lorem ipsum dolor sit amet, consectetur adipiscing elit. Suspendisse varius enim in eros elementum tristique. Duis cursus, mi quis viverra ornare, eros dolor interdum nulla, ut commodo diam libero vitae erat. Aenean faucibus nibh et justo cursus id rutrum lorem imperdiet. Nunc ut sem vitae risus tristique posuere.
This is some text inside of a div block.
Lorem ipsum dolor sit amet, consectetur adipiscing elit. Suspendisse varius enim in eros elementum tristique. Duis cursus, mi quis viverra ornare, eros dolor interdum nulla, ut commodo diam libero vitae erat. Aenean faucibus nibh et justo cursus id rutrum lorem imperdiet. Nunc ut sem vitae risus tristique posuere.

.svg)
.svg)