DOOH can scale fast, but performance usually hinges on inventory quality: where your ads run, how they play, and how confidently you can verify the result. In this article, we’ll break down the quality standards that matter, why access models shape campaign outcomes, and how advertisers can build more accountable DOOH advertising.
DOOH inventory has never been easier to buy at scale. What’s harder is buying it well—in a way that protects brand outcomes, pacing, and measurement integrity.
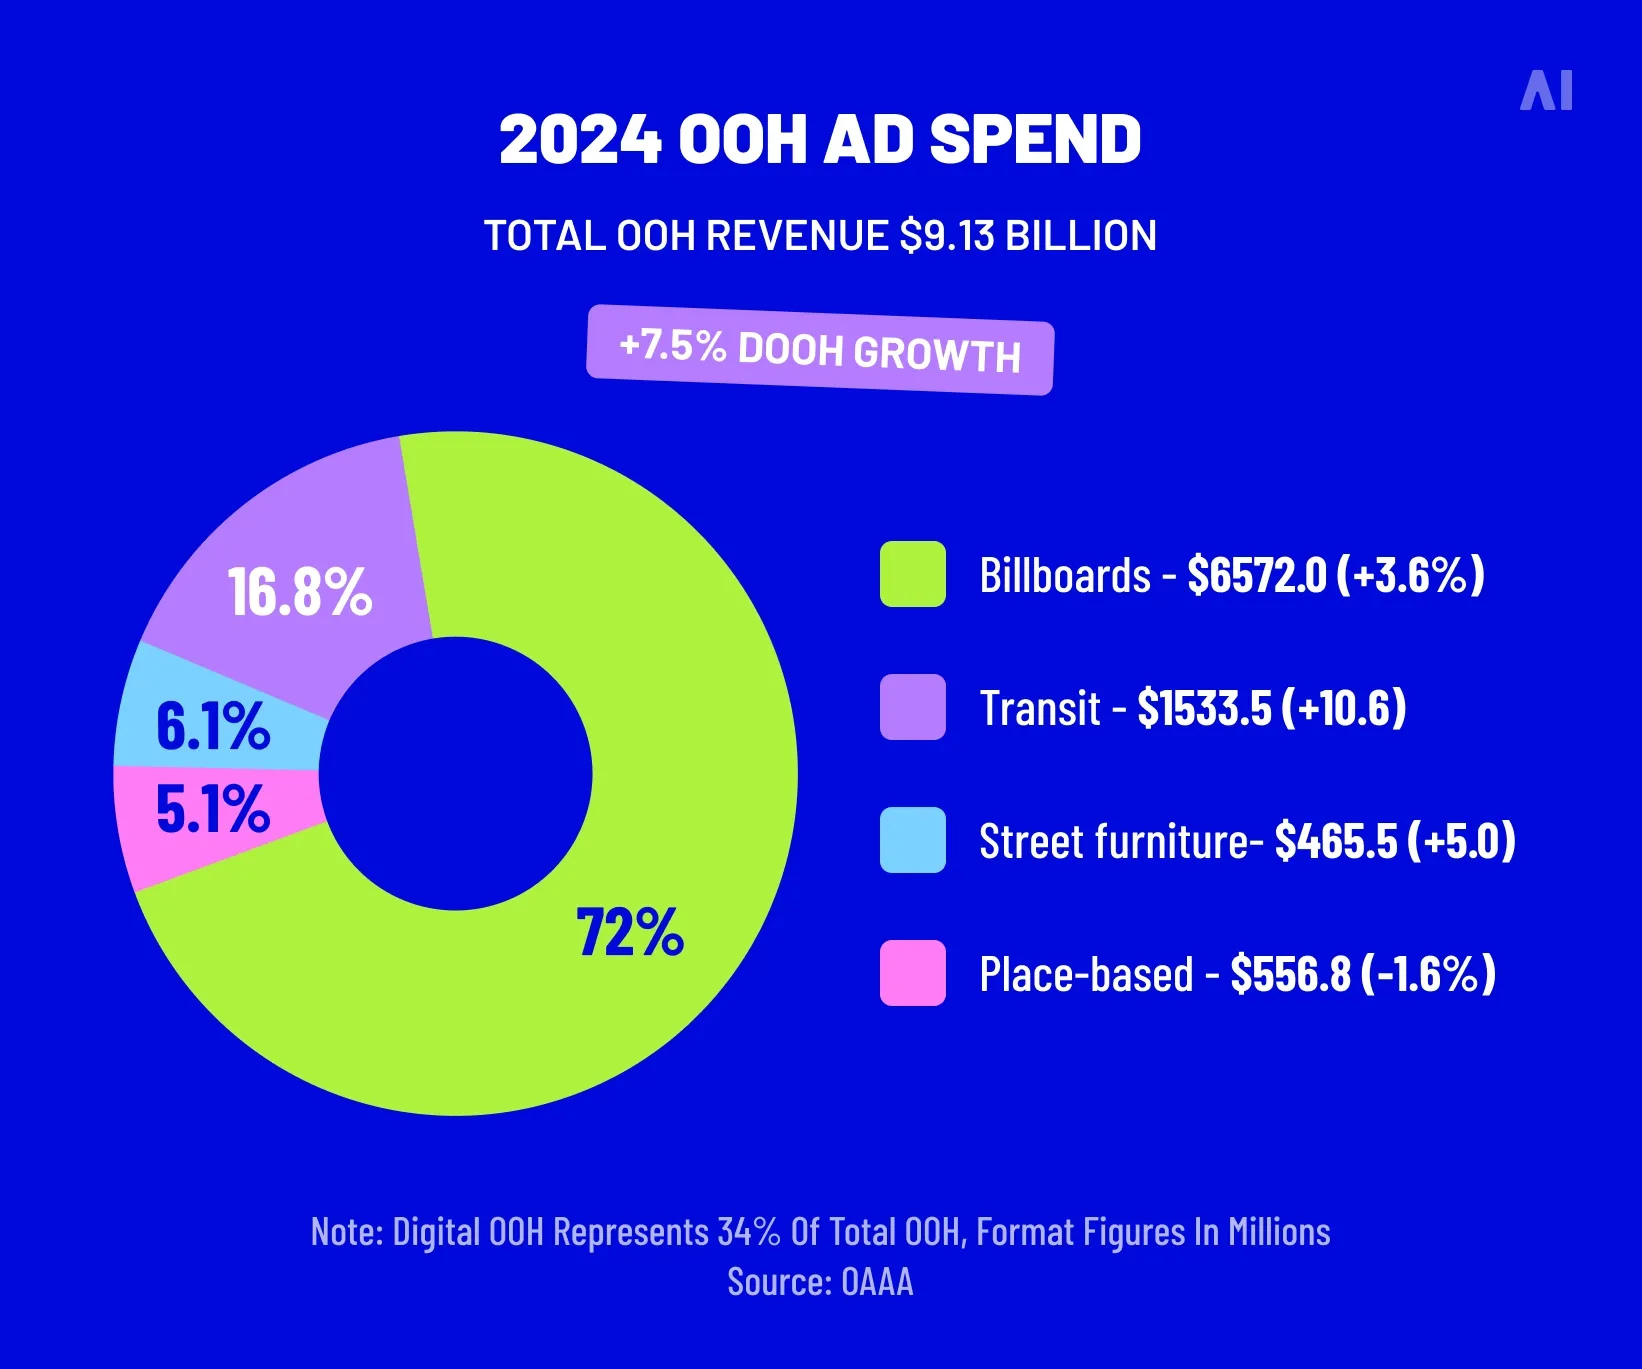
In the U.S., out-of-home revenue reached$9.1B in 2024, and digital made up roughly 34% of that total.Those numbers are a reminder that DOOH is no longer a niche line item. But they also hint at the trap: when “more screens” becomes the strategy, quality standards quietly slip then performance (and reporting confidence) slips right after.
⚡ In DOOH, screen count is a vanity metric unless the placement is right and the delivery proof is solid enough to trust.
This article breaks down what DOOH inventory quality actually means, the three dimensions that define it, and why access models (fragmented vs. consolidated) are a hidden performance variable. We’ll also cover how quality affects agency margins, and what standards decision-makers should demand before they call a DOOH plan “premium.”
💡 For a refresher on DOOH basics and where it fits in the mix, see AI Digital’s primer on DOOH advertising.
What DOOH inventory quality really means
“Inventory quality” in DOOH isn’t a single attribute like resolution or venue category. It’s a system.
At a practical level, DOOH inventory quality is the likelihood that an impression is:
Delivered where you intended (right venue, right screen, right context)
Shown as you intended (correct playback, correct creative rendering, correct loop behavior)
Counted and reported in a way that stands up to scrutiny (transparent methodology, consistent measurement, auditable logs)
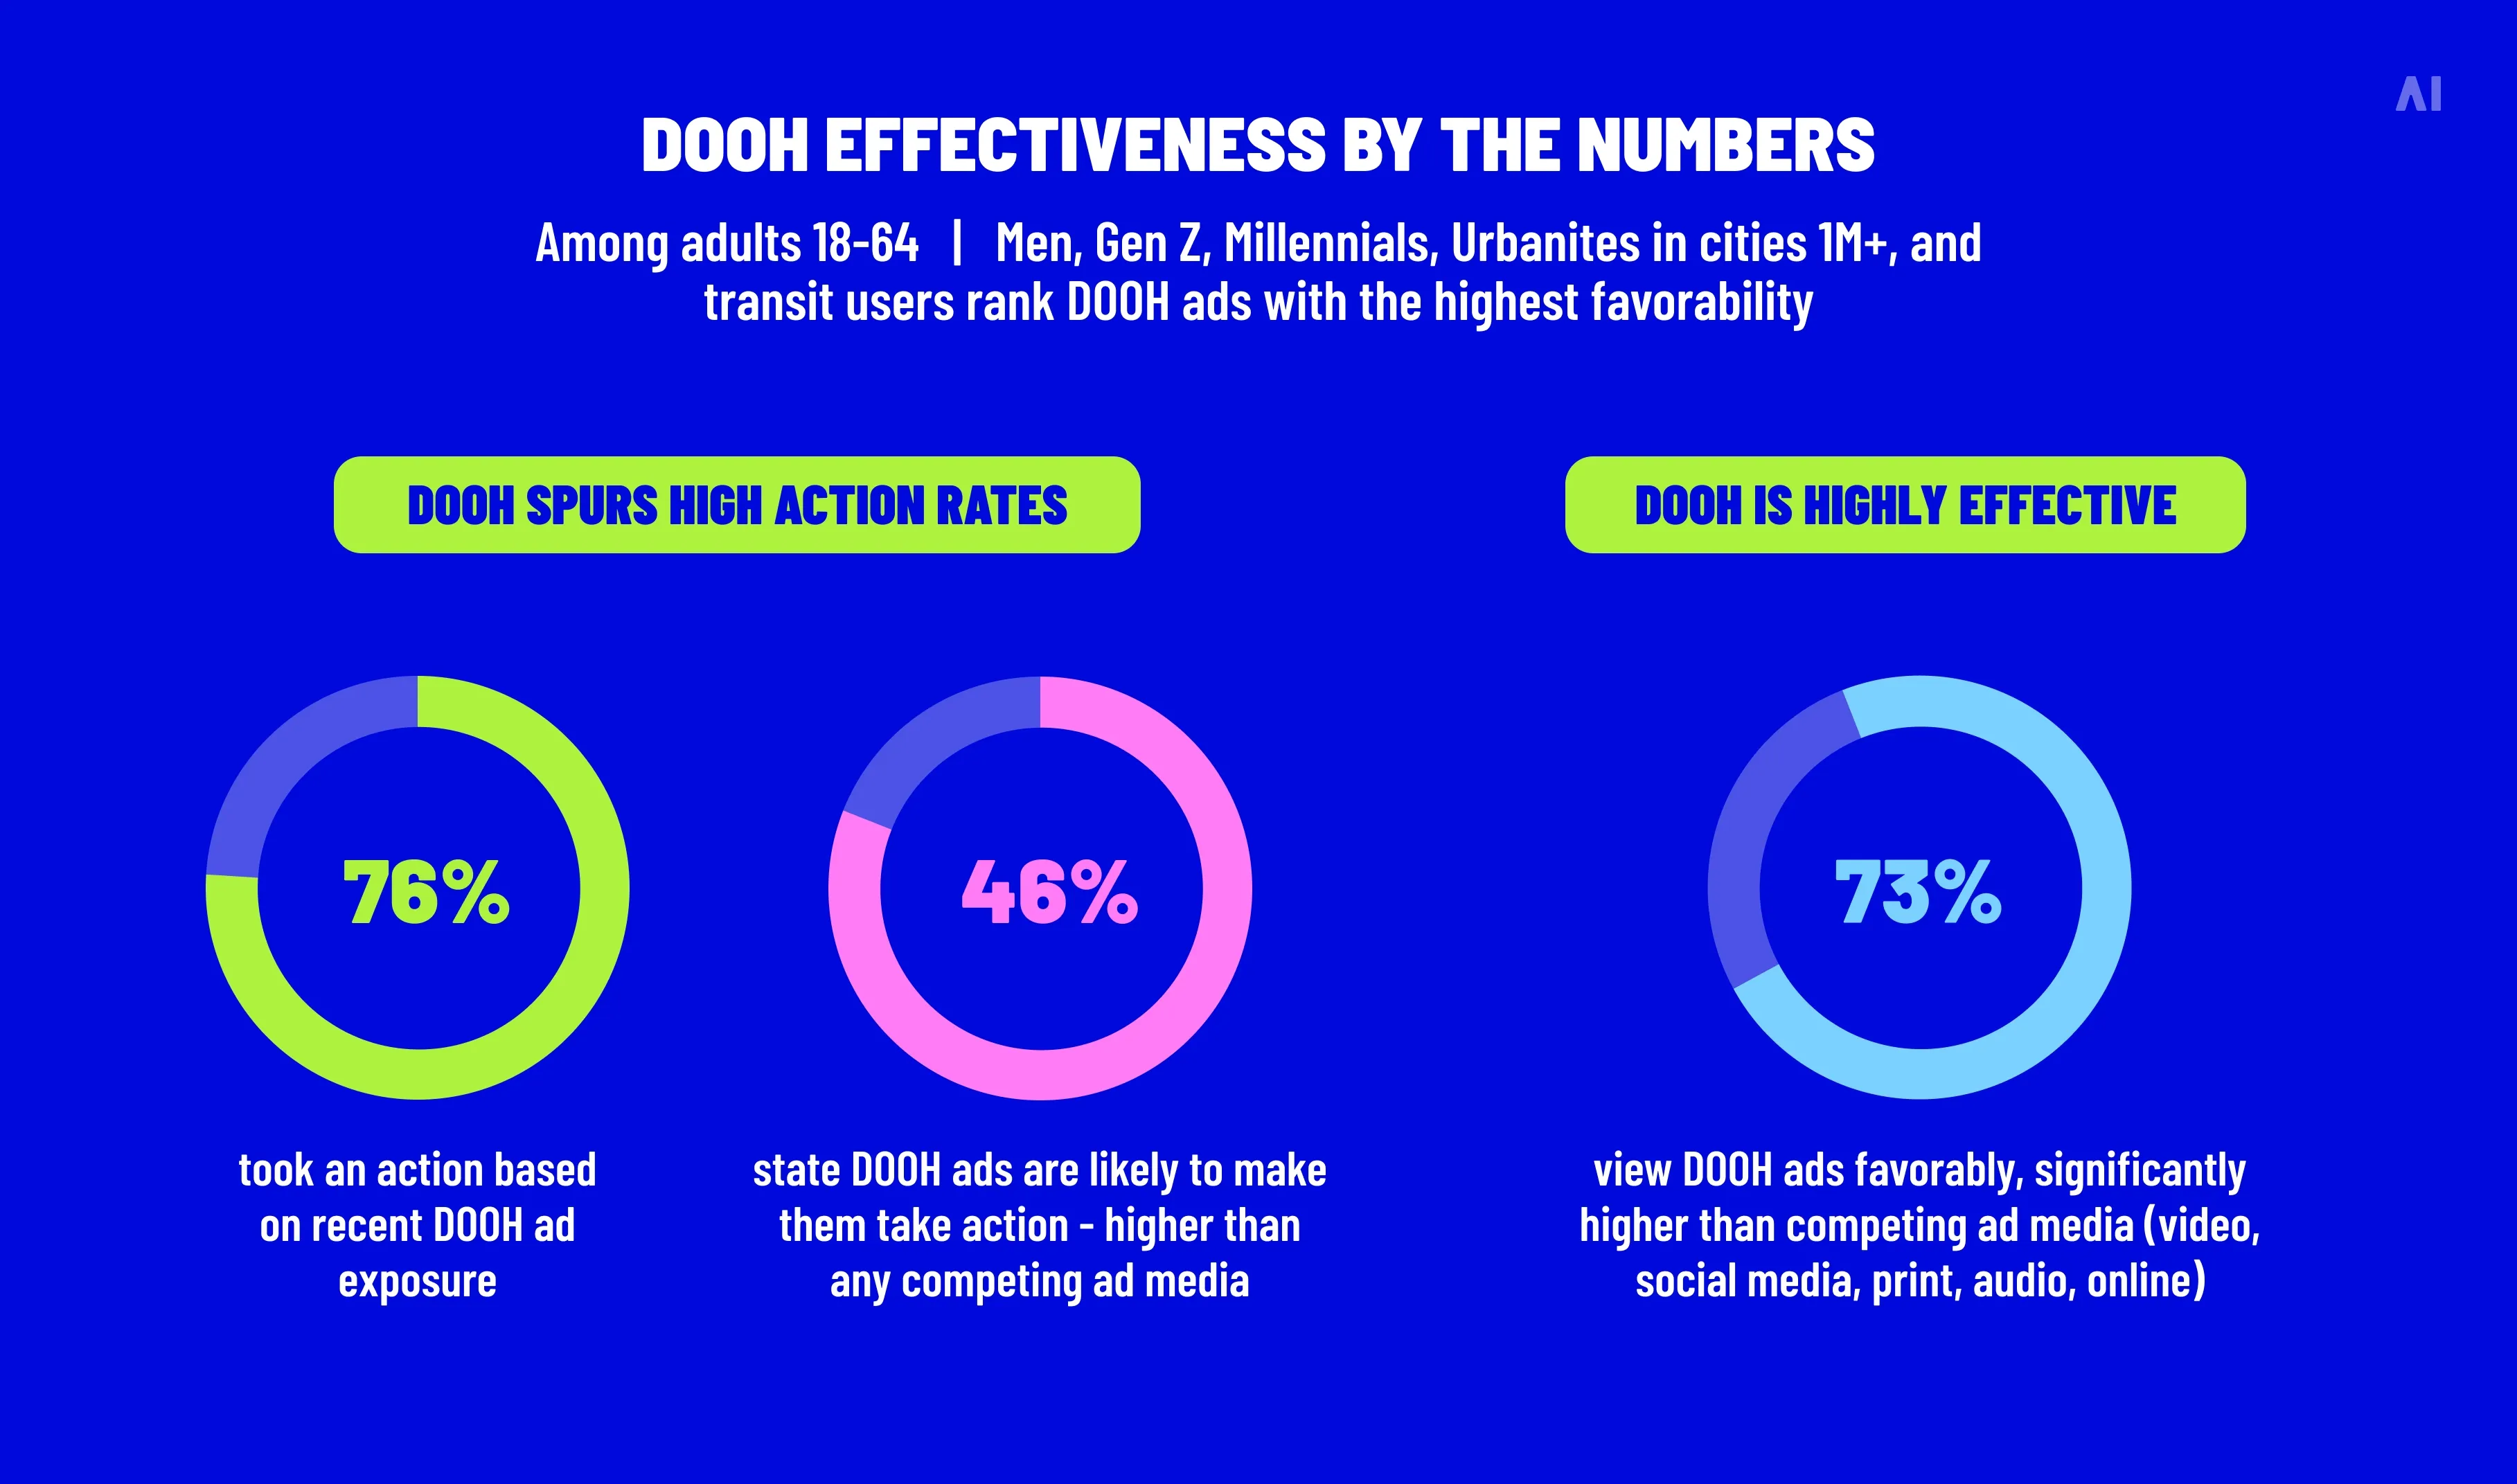
That last point matters because DOOH is increasingly asked to prove outcomes, not just presence. In a 2024 OAAA/Harris Poll study, 76% of adults reported taking action after seeing a DOOH ad, and among those actions were store visits and mobile behaviors.DOOH can move people—but the industry only benefits when buyers can separate high-performing supply from “available” supply.
The simplest way to think about it:
⚡ Quality is the difference between “ads ran” and “campaign performed.”
Even broad category movement can hint at where attention is concentrating. OAAA reportedtransit revenues grew 10.6% in 2024, one of the stronger category gains.But “transit” still covers everything from high-dwell commuter rail platforms to fast-moving roadside assets near highways. Treating them as interchangeable is how performance gets diluted.
⚡ Directional creative is where location becomes a lever. 51% of people who noticed directional DOOH ads visited the business.
What quality looks like in environment/context
A quality-first DOOH plan doesn’t just ask, “Is it a screen in retail?” It asks:
Is the environment aligned to the job-to-be-done? (awareness, intent, store visit, event attendance)
Does the context support the creative format? (short copy vs. rich visual vs. directional CTA)
Do we have verification at the venue/screen level? (not just a venue list or network name)
This is also where DOOH starts to overlap with in-store retail media. The IAB’s In-Store Retail Media Definitions & Standards (Dec 2024) show where the market is heading: tighter definitions for store zones, ad formats, and measurement expectations.DOOH inventory quality in retail environments increasingly depends on whether supply can meet standards that look more like “measured media,” not “unmeasured placement.”
Can the seller provide screen-level location details (not only network-level)?
Is there clear category taxonomy (and consistency across partners)?
Can you confirm brand safety controls (venue content policies, adjacency exclusions)?
Is the inventory aligned to dwell time realities (not wishful thinking)?
⚡ If context doesn’t match the message, the impression is technically delivered and strategically wasted.
2. Screen and presentation standards
Screen quality is not only about “HD vs. not HD.” It’s about whether a screen behaves like a reliable media product:
Playback consistency
Brightness/visibility in the environment
Creative rendering accuracy
Loop length reality vs. what’s assumed in planning
Downtime and outage handling
Makegoods and reconciliation discipline
When those variables aren’t controlled, your plan may be “large,” but your effective reach and frequency can be much smaller than reported.
{{26-why-DOOH-Inventory-Quality-3="/tables"}}
A useful way to frame this is to treat screens like retail shelves: if the product isn’t actually on the shelf, the sales forecast doesn’t matter.
There’s also a creative-performance connection. A 2024 multi-year study from Clear Channel Outdoor and Kantar found OOH drives measurable brand effects—including +13.3% lift in ad awareness, +9.8% lift in purchase intent, and +7.8% lift in brand favorability (results varied by mix and context).Those outcomes depend on ads being seen as designed, not clipped, poorly rendered, or lost in unpredictable loops.
What quality looks like in screen/presentation:
Defined standards for playback (what counts as a valid play, how it’s logged)
Creative QA (proof your file renders correctly on the actual screen spec)
This is where DOOH either becomes a performance channel or stays a planning-channel with performance storytelling layered on top.
In 2025, eMarketer noted programmatic DOOH as a growth driver and forecast programmatic DOOH reaching about $1.23B by 2026.Growth like that attracts more buyers, more intermediaries, and more measurement vendors. Without standards, “more” quickly becomes “messier.”
So what counts as quality in data and accountability?
At minimum, you want:
Proof of play / proof of performance (ad ran, when, where, how often)
Transparent impression methodology (how impressions are derived, what’s modeled)
Outcome measurement options (footfall lift, site visits, app actions), with privacy-safe methods
⚡ DOOH doesn’t end at the screen. In a Harris Poll study for OAAA, 74% of mobile device users (18–64) took a device action after recent DOOH ad exposure.
Social media-related actions after seeing OOH (Source)
The MRC’s Out-of-Home Measurement Standards emphasizetransparency around methods and encourage independent audit under confidentiality for proprietary elements, plus ongoing validation of underlying inputs.That’s not an abstract governance point, it’s a practical quality gate.
And buyers are explicitly pushing for independent validation. A 2024 Place Exchange announcement (re: a DPPA survey) stated that independent verification was considered the #1 measurement/attribution capability expected to drive future DOOH growth among U.S. omnichannel advertisers.
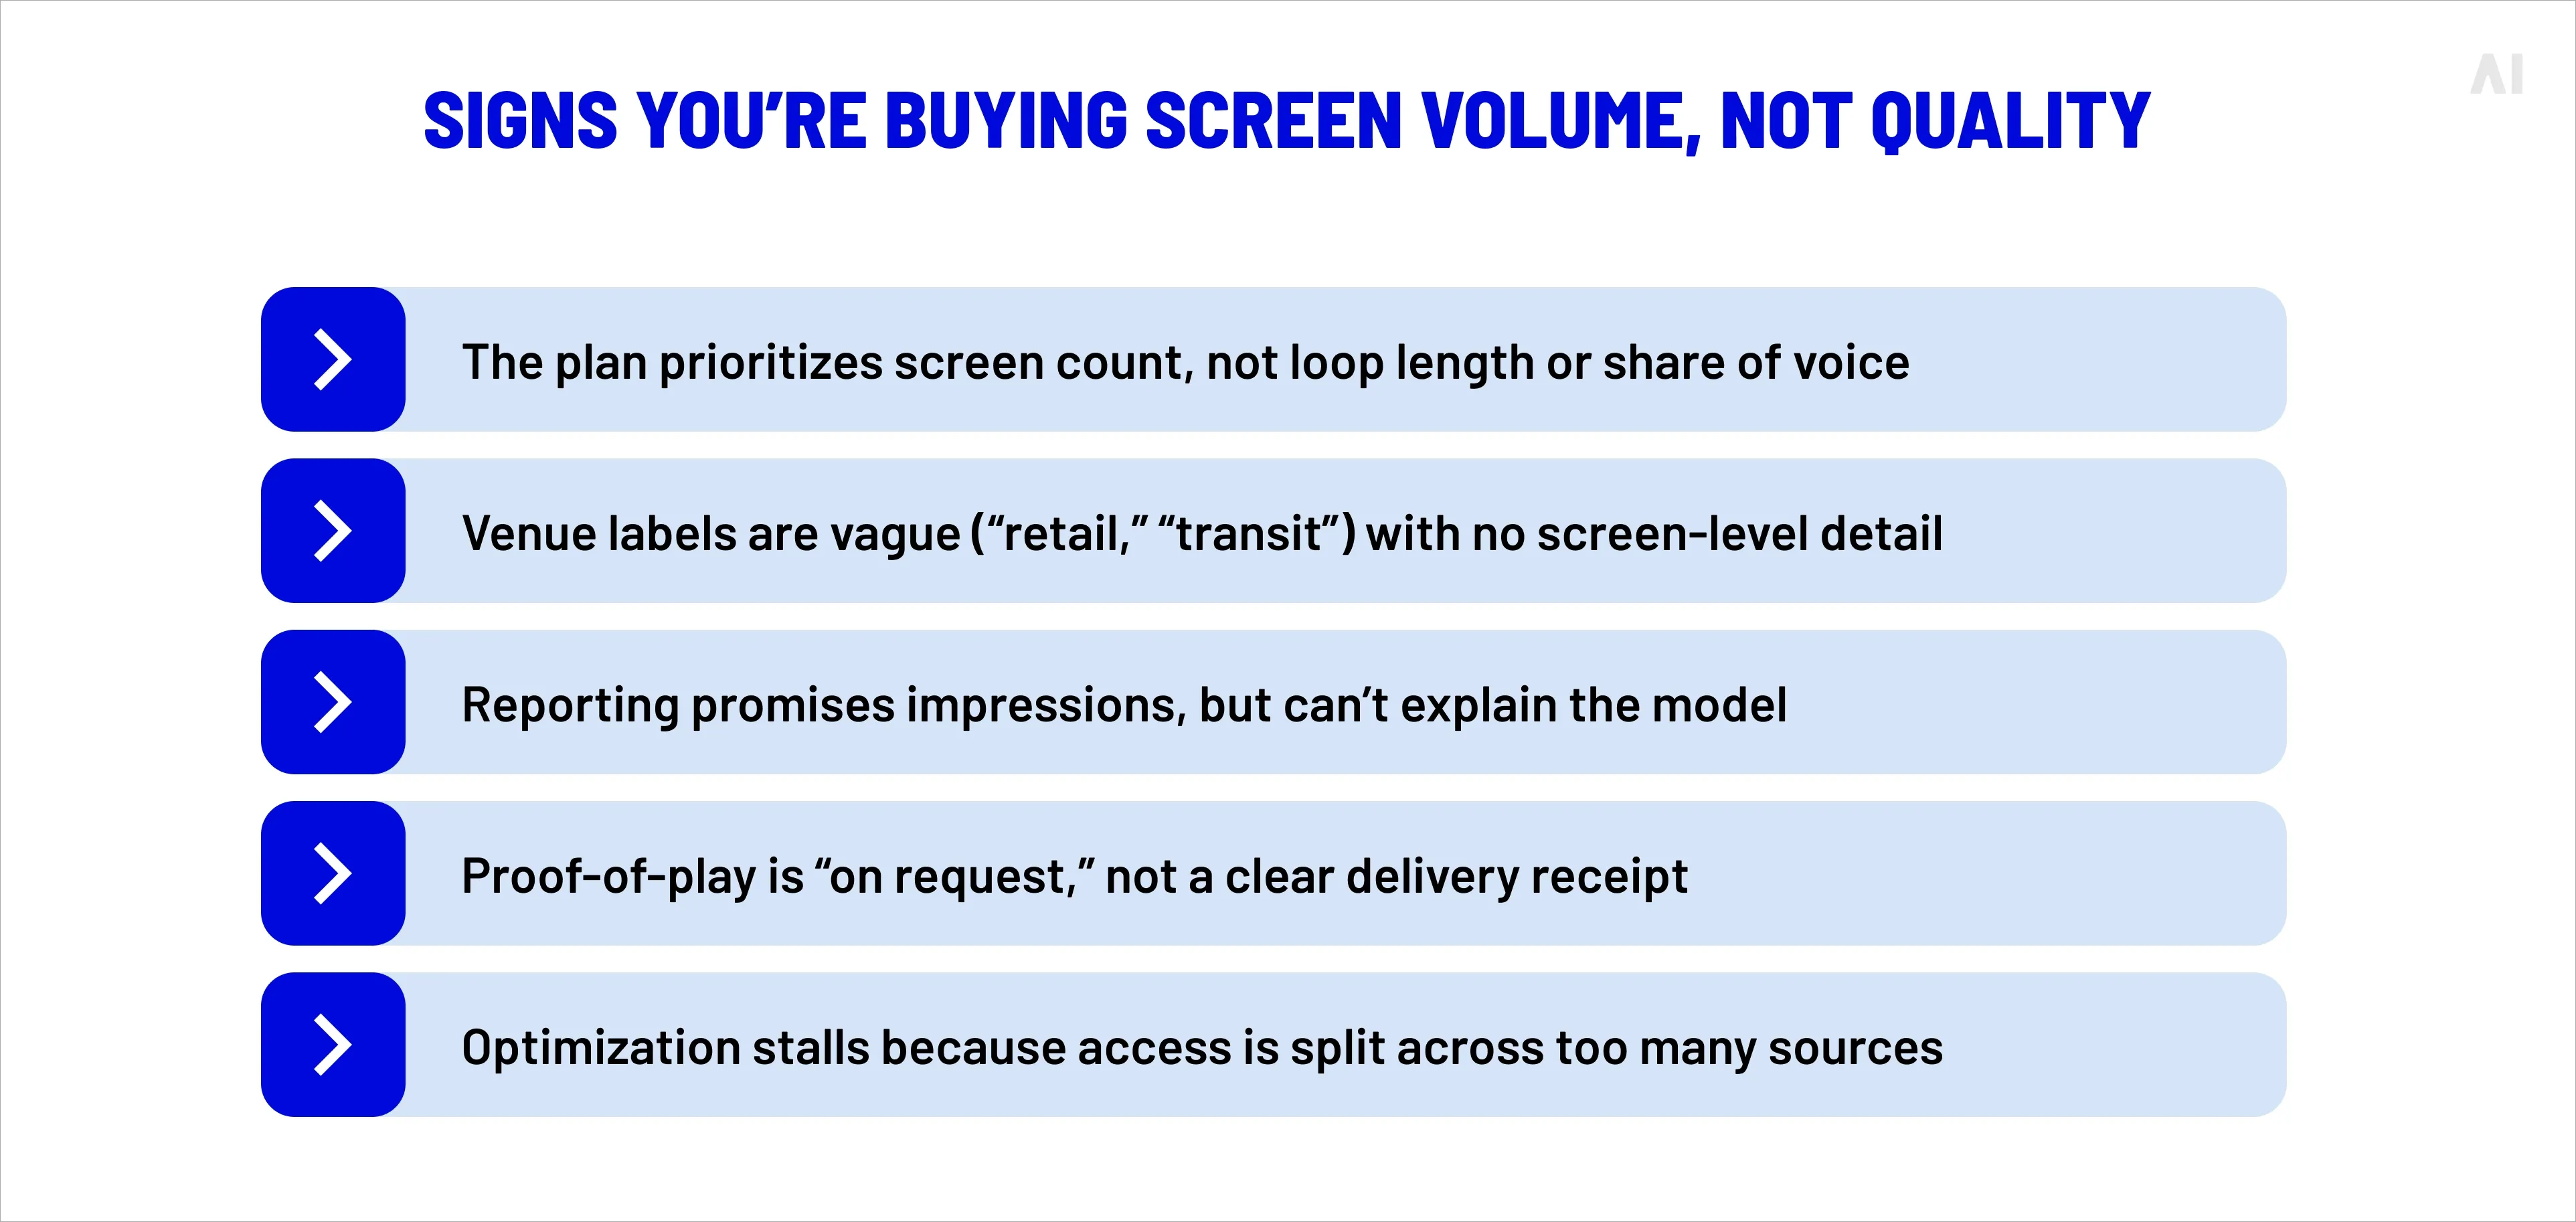
Where quality breaks down
“Proof of play” exists, but it’s not buyer-accessible
Impression numbers are provided, but methodology is vague
Outcome measurement exists, but inputs and match logic are opaque
Reporting is “available,” but not reconcilable across partners
Most buyers think performance is driven by which screens they select. That’s only half the story.
In DOOH buying, how you access inventory can be just as important as which screens you choose—because access models determine:
Fee layers and hidden costs
Duplicate supply exposure (the same screen appearing through multiple paths)
Reporting consistency
Verification availability
Optimization speed (how fast you can move budget to what’s working)
This is why access models are a hidden performance variable in DOOH.
{{26-why-DOOH-Inventory-Quality-4="/tables"}}
⚡ Budgets are moving, and expectations are rising with them. A DPAA study found96% of marketers and agencies plan to increase or maintain DOOH spending over the next 12 months.
Before we get tactical, it helps to name the reality: measurement and workflows across DOOH are still inconsistent. The IAB’s 2025 DOOH Measurement Guide notes that, despite DOOH’s growth and integration into digital planning, measurement practices remain fragmented and often misunderstood.
That fragmentation shows up in access patterns too.
Multiple reporting surfaces that don’t reconcile cleanly
The costs aren’t always visible in CPM alone. They show up as:
Slower optimization (and slower learning): Every new supply path adds another set of quirks: reporting cadence, creative handling, approval steps, and targeting constraints. That friction delays the only thing that matters mid-flight: moving budget toward what’s working.
Inconsistent standards across the same plan: One subset of screens may have strong proof-of-play logs. Another subset may provide basic delivery summaries. When the campaign ends, “performance” becomes an argument about what should count, not a clear result.
Fee stacking and path inefficiency: Programmatic advertising has spent years trying to reduce waste and redundancy. Digiday, citing ANA’s transparency benchmark work, reported$26.8B in global programmatic media value lost annually to issues including redundant supply paths, measurement gaps, and low-quality inventory.DOOH isn’t identical to open-web programmatic, but the lesson transfers: redundant paths and unclear standards create avoidable leakage.
A bigger reconciliation problem: Fragmentation increases the chance of duplicated supply, mismatched logs, and makegoods disputes. The campaign might “deliver,” but trust erodes, and that’s how DOOH budgets get questioned in QBRs.
⚡ Fragmentation doesn’t just add complexity. It adds delay, disagreement, and performance dilution.
Why consolidated inventory performs better
Consolidated access doesn’t mean “one vendor forever.” It means fewer hops, clearer standards, and faster control.
A consolidated access model tends to outperform because it enables:
Clean supply paths: Fewer intermediaries means fewer places for fees to accumulate and fewer surfaces where quality controls can break.
Standardized verification and reporting: When inventory is governed under one consistent set of standards (or certifications), “proof” becomes easier to audit and compare.
Faster optimization loops: Budget can move toward better environments, better screens, and better outcomes without negotiating a maze of mismatched constraints.
Better accountability: When delivery, playback, and measurement are unified, it’s harder for underperformance to hide inside reporting noise.
Simple comparison table:
{{26-why-DOOH-Inventory-Quality-5="/tables"}}
How inventory quality impacts agency margins
DOOH inventory quality is usually discussed as a brand performance issue. It’s also an agency economics issue.
Here’s why: modern agencies aren’t paid only for “planning.” They’re paid for execution, measurement, optimization, and proof.
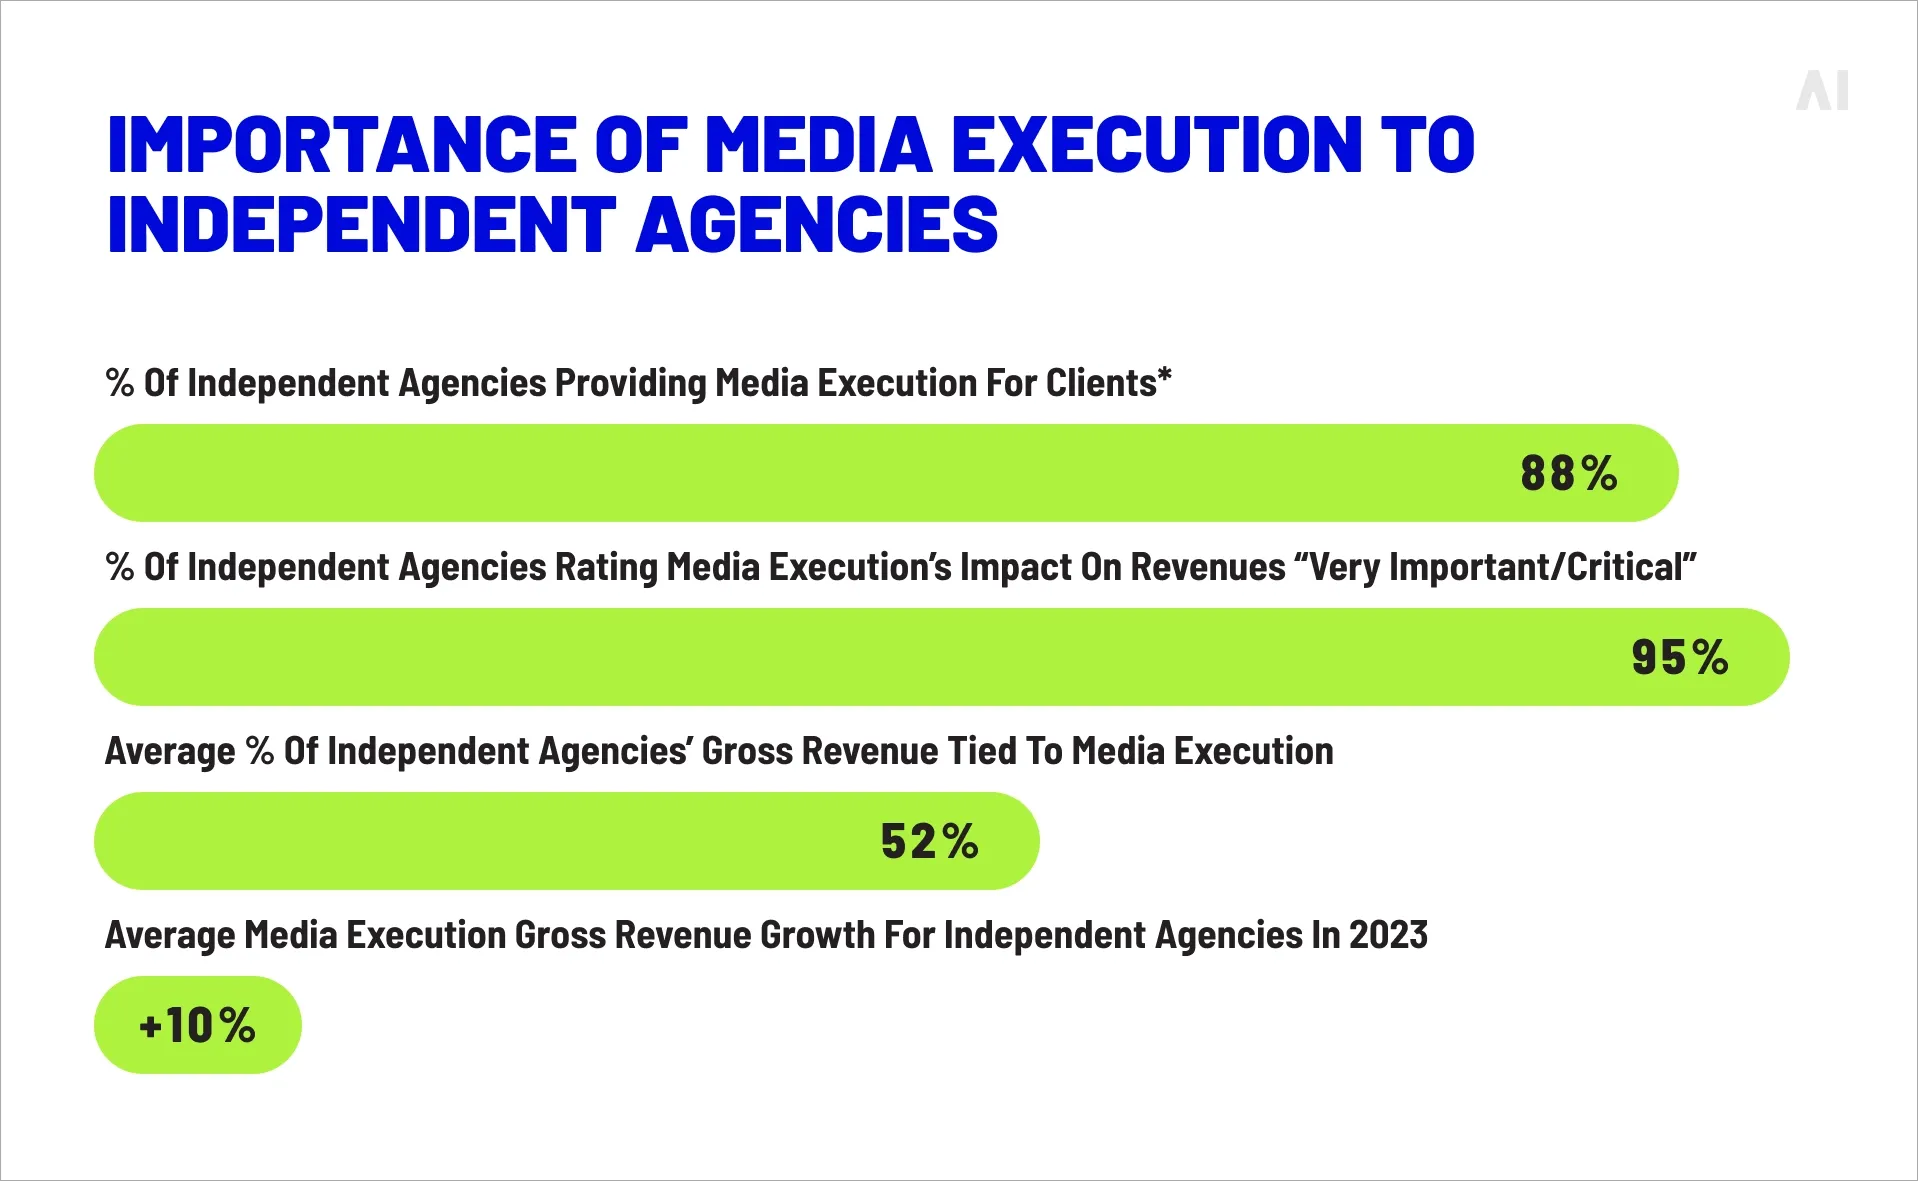
In a 2024 AdExchanger/Pathlabs report, 88% of surveyed independent agencies said they provide media execution services, and agencies reported an average of 52% of gross revenue tied to media execution.When execution is that central, anything that increases operational drag hits margin directly.
Importance of media execution to independent agencies (Source)
Inventory quality affects margins through:
Labor cost and workflow sprawl: Fragmented DOOH supply means more trafficking steps, more reporting reconciliation, more exceptions, more screenshots, more “can you confirm this ran?” emails.
Makegoods and dispute overhead: Low-quality inventory tends to create more reconciliation work, which is rarely billable at full value.
Fee pressure and performance skepticism: When performance is unclear, clients push harder on fees. When performance is clear and defensible, it’s easier to hold the line on scope and pricing.
Tooling duplication: More supply paths often means more dashboards, tags, verification layers, and custom reporting. That adds tech cost and time cost.
💡 If you want a practical viewpoint on why DSP-agnostic, consolidated buying approaches can reduce fragmentation in media buying, see AI Digital’s take on a DSP-agnostic approach.
⚡ Inventory quality protects performance, and it protects the time it takes to prove performance.
A performance-first approach to DOOH inventory quality
A performance-first approach treats inventory quality like a measurable system with gates, not a subjective preference.
Below is a practical framework decision-makers can use.
Environment verification
This is where you confirm that “retail” means the retail environment you paid for and that the context supports the campaign objective.
Environment verification should include:
Screen-level location verification (address or precise venue identifier)
Environment taxonomy (consistent definitions across partners)
Brand safety rules tailored to venue types
Dwell-time expectations aligned to creative length and CTA complexity
In in-store contexts, the IAB’s work on in-store definitions and measurement standards signals the direction of travel: clearer zone definitions, clearer format definitions, and higher expectations for comparable measurement.
Practical tip: If a partner can’t describe the environment beyond a broad label, treat the inventory as unverified until proven otherwise.
Screen and playback validation
Playback validation is the difference between scheduled delivery and actual delivery.
At minimum, you want:
Proof-of-play / proof-of-performance logs
Clear rules for what counts as a valid play
Downtime disclosure and makegood policy clarity
Creative rendering QA (especially across mixed specs)
MRC measurement standards emphasize transparency and periodic validation of underlying information used for measurement. That philosophy fits playback too: if the underlying delivery record can’t be validated, the impression story is fragile.
Audience data accuracy
Audience accuracy in DOOH is always a mix of direct inputs and modeling. The question is whether the methodology is consistent, transparent, and aligned to standards.
A quality-first audience approach includes:
Clear definitions (impressions vs. reach vs. frequency vs. “opportunities to see”)
Consistent methodology across inventory sources
Transparent modeling assumptions and versioning
Lift-based measurement options when outcomes matter
The MRC standards explicitly promote transparency around methods and encourage independent audit under confidentiality. That’s the posture you want from any partner claiming “premium audience data.”
AI Digital’s Smart Supply is designed to reduce fragmentation and bias by selecting clean supply paths and structuring access so that “premium” means verifiable, not just labeled.
The key is not the dashboard itself. It’s what the dashboard enables: faster, defensible decisions about what to keep, what to fix, and what to remove.
DOOH inventory standards decision-makers should demand
Quality improves fastest when buyers demand consistent standards. Here are practical standards to require before scaling spend.
{{26-why-DOOH-Inventory-Quality-6="/tables"}}
Transparent inventory
Demand clarity on:
Exactly which screens are eligible (screen-level, not vague network labels)
Where those screens are (venue and environment details)
How often the screen list is updated
Whether screens are resold through multiple paths
If transparency is weak, you’re not buying premium inventory, you’re buying uncertainty.
Verified playback and reporting
Playback verification should be treated as non-negotiable.
Look for:
Proof-of-play logs accessible to buyers
Clear reconciliation rules (what counts, what doesn’t)
Makegood policies stated up front
Consistency across partners (so you’re not mixing incompatible reporting standards)
Independent verification demand is rising, and industry infrastructure is responding. The Place Exchange/Veridooh partnership announcement points directly to that buyer pressure.
DOOH works best when “scale” is defined as repeatable performance rather than the longest possible screen list, because once you pressure-test inventory using the same criteria you apply to other performance channels—context, presentation reliability, and accountable reporting—you stop paying for impressions that look strong in a spreadsheet but don’t hold up in the real world.
The shift is straightforward and operational: verify the environments you’re buying into, validate that playback actually happens as planned, and treat audience data as a measurement product that needs scrutiny, not a guess you accept by default. From there, choose access models that keep supply paths clean so you can optimize quickly and report with confidence, and when those pieces are in place, DOOH inventory becomes a lever you can pull with control instead of a variable you’re hoping behaves.
If you want to operationalize the “quality-first” approach in this article, AI Digital can support you in a few ways:
DSP-agnostic execution under the Open Garden framework— so inventory decisions are driven by outcomes and transparency, not platform bias.
Managed Service support for planning, execution, and ongoing optimization across channels, with KPI alignment as the foundation.
Smart Supplyto filter out low-value or risky supply, optimize supply paths, and give you clearer visibility into where ads run and what you’re paying for.
Supply path cleanup that reduces wasted hops—including removing indirect traffic that can inflate costs and muddy performance signals.
Platform-level intelligence with Elevate to unify cross-platform insight and support faster decisions with ongoing optimization workflows.
If you’re planning a DOOH campaign and want to audit inventory quality before you commit budget, get in touch with AI Digital. We’ll help you validate your DOOH inventory strategy, tighten access, and build a plan you can optimize and defend.
Blind spot
Key issues
Business impact
AI Digital solution
Lack of transparency in AI models
• Platforms own AI models and train on proprietary data • Brands have little visibility into decision-making • "Walled gardens" restrict data access
• Inefficient ad spend • Limited strategic control • Eroded consumer trust • Potential budget mismanagement
Open Garden framework providing: • Complete transparency • DSP-agnostic execution • Cross-platform data & insights
Optimizing ads vs. optimizing impact
• AI excels at short-term metrics but may struggle with brand building • Consumers can detect AI-generated content • Efficiency might come at cost of authenticity
• Short-term gains at expense of brand health • Potential loss of authentic connection • Reduced effectiveness in storytelling
Smart Supply offering: • Human oversight of AI recommendations • Custom KPI alignment beyond clicks • Brand-safe inventory verification
The illusion of personalization
• Segment optimization rebranded as personalization • First-party data infrastructure challenges • Personalization vs. surveillance concerns
• Potential mismatch between promise and reality • Privacy concerns affecting consumer trust • Cost barriers for smaller businesses
Elevate platform features: • Real-time AI + human intelligence • First-party data activation • Ethical personalization strategies
AI-Driven efficiency vs. decision-making
• AI shifting from tool to decision-maker • Black box optimization like Google Performance Max • Human oversight limitations
• Strategic control loss • Difficulty questioning AI outputs • Inability to measure granular impact • Potential brand damage from mistakes
Managed Service with: • Human strategists overseeing AI • Custom KPI optimization • Complete campaign transparency
Fig. 1. Summary of AI blind spots in advertising
Dimension
Walled garden advantage
Walled garden limitation
Strategic impact
Audience access
Massive, engaged user bases
Limited visibility beyond platform
Reach without understanding
Data control
Sophisticated targeting tools
Data remains siloed within platform
Fragmented customer view
Measurement
Detailed in-platform metrics
Inconsistent cross-platform standards
Difficult performance comparison
Intelligence
Platform-specific insights
Limited data portability
Restricted strategic learning
Optimization
Powerful automated tools
Black-box algorithms
Reduced marketer control
Fig. 2. Strategic trade-offs in walled garden advertising.
Core issue
Platform priority
Walled garden limitation
Real-world example
Attribution opacity
Claiming maximum credit for conversions
Limited visibility into true conversion paths
Meta and TikTok's conflicting attribution models after iOS privacy updates
Data restrictions
Maintaining proprietary data control
Inability to combine platform data with other sources
Amazon DSP's limitations on detailed performance data exports
Cross-channel blindspots
Keeping advertisers within ecosystem
Fragmented view of customer journey
YouTube/DV360 campaigns lacking integration with non-Google platforms
Black box algorithms
Optimizing for platform revenue
Reduced control over campaign execution
Self-serve platforms using opaque ML models with little advertiser input
Performance reporting
Presenting platform in best light
Discrepancies between platform-reported and independently measured results
Consistently higher performance metrics in platform reports vs. third-party measurement
Fig. 1. The Walled garden misalignment: Platform interests vs. advertiser needs.
Key dimension
Challenge
Strategic imperative
ROAS volatility
Softer returns across digital channels
Shift from soft KPIs to measurable revenue impact
Media planning
Static plans no longer effective
Develop agile, modular approaches adaptable to changing conditions
Brand/performance
Traditional division dissolving
Create full-funnel strategies balancing long-term equity with short-term conversion
Capability
Key features
Benefits
Performance data
Elevate forecasting tool
• Vertical-specific insights • Historical data from past economic turbulence • "Cascade planning" functionality • Real-time adaptation
• Provides agility to adjust campaign strategy based on performance • Shows which media channels work best to drive efficient and effective performance • Confident budget reallocation • Reduces reaction time to market shifts
• Dataset from 10,000+ campaigns • Cuts response time from weeks to minutes
• Reaches people most likely to buy • Avoids wasted impressions and budgets on poor-performing placements • Context-aligned messaging
• 25+ billion bid requests analyzed daily • 18% improvement in working media efficiency • 26% increase in engagement during recessions
Full-funnel accountability
• Links awareness campaigns to lower funnel outcomes • Tests if ads actually drive new business • Measures brand perception changes • "Ask Elevate" AI Chat Assistant
• Upper-funnel to outcome connection • Sentiment shift tracking • Personalized messaging • Helps balance immediate sales vs. long-term brand building
• Natural language data queries • True business impact measurement
Open Garden approach
• Cross-platform and channel planning • Not locked into specific platforms • Unified cross-platform reach • Shows exactly where money is spent
• Reduces complexity across channels • Performance-based ad placement • Rapid budget reallocation • Eliminates platform-specific commitments and provides platform-based optimization and agility
• Coverage across all inventory sources • Provides full visibility into spending • Avoids the inability to pivot across platform as you’re not in a singular platform
Fig. 1. How AI Digital helps during economic uncertainty.
Trend
What it means for marketers
Supply & demand lines are blurring
Platforms from Google (P-Max) to Microsoft are merging optimization and inventory in one opaque box. Expect more bundled “best available” media where the algorithm, not the trader, decides channel and publisher mix.
Walled gardens get taller
Microsoft’s O&O set now spans Bing, Xbox, Outlook, Edge and LinkedIn, which just launched revenue-sharing video programs to lure creators and ad dollars. (Business Insider)
Retail & commerce media shape strategy
Microsoft’s Curate lets retailers and data owners package first-party segments, an echo of Amazon’s and Walmart’s approaches. Agencies must master seller-defined audiences as well as buyer-side tactics.
AI oversight becomes critical
Closed AI bidding means fewer levers for traders. Independent verification, incrementality testing and commercial guardrails rise in importance.
Fig. 1. Platform trends and their implications.
Metric
Connected TV (CTV)
Linear TV
Video Completion Rate
94.5%
70%
Purchase Rate After Ad
23%
12%
Ad Attention Rate
57% (prefer CTV ads)
54.5%
Viewer Reach (U.S.)
85% of households
228 million viewers
Retail Media Trends 2025
Access Complete consumer behaviour analyses and competitor benchmarks.
Identify and categorize audience groups based on behaviors, preferences, and characteristics
Michaels Stores: Implemented a genAI platform that increased email personalization from 20% to 95%, leading to a 41% boost in SMS click through rates and a 25% increase in engagement.
Estée Lauder: Partnered with Google Cloud to leverage genAI technologies for real-time consumer feedback monitoring and analyzing consumer sentiment across various channels.
High
Medium
Automated ad campaigns
Automate ad creation, placement, and optimization across various platforms
Showmax: Partnered with AI firms toautomate ad creation and testing, reducing production time by 70% while streamlining their quality assurance process.
Headway: Employed AI tools for ad creation and optimization, boosting performance by 40% and reaching 3.3 billion impressions while incorporating AI-generated content in 20% of their paid campaigns.
High
High
Brand sentiment tracking
Monitor and analyze public opinion about a brand across multiple channels in real time
L’Oréal: Analyzed millions of online comments, images, and videos to identify potential product innovation opportunities, effectively tracking brand sentiment and consumer trends.
Kellogg Company: Used AI to scan trending recipes featuring cereal, leveraging this data to launch targeted social campaigns that capitalize on positive brand sentiment and culinary trends.
High
Low
Campaign strategy optimization
Analyze data to predict optimal campaign approaches, channels, and timing
DoorDash: Leveraged Google’s AI-powered Demand Gen tool, which boosted its conversion rate by 15 times and improved cost per action efficiency by 50% compared with previous campaigns.
Kitsch: Employed Meta’s Advantage+ shopping campaigns with AI-powered tools to optimize campaigns, identifying and delivering top-performing ads to high-value consumers.
High
High
Content strategy
Generate content ideas, predict performance, and optimize distribution strategies
JPMorgan Chase: Collaborated with Persado to develop LLMs for marketing copy, achieving up to 450% higher clickthrough rates compared with human-written ads in pilot tests.
Hotel Chocolat: Employed genAI for concept development and production of its Velvetiser TV ad, which earned the highest-ever System1 score for adomestic appliance commercial.
High
High
Personalization strategy development
Create tailored messaging and experiences for consumers at scale
Stitch Fix: Uses genAI to help stylists interpret customer feedback and provide product recommendations, effectively personalizing shopping experiences.
Instacart: Uses genAI to offer customers personalized recipes, mealplanning ideas, and shopping lists based on individual preferences and habits.
Medium
Medium
Share article
Url copied to clipboard
No items found.
Subscribe to our Newsletter
THANK YOU FOR YOUR SUBSCRIPTION
Oops! Something went wrong while submitting the form.
Questions? We have answers
How is DOOH inventory different from traditional OOH?
DOOH inventory is digitally delivered and often programmatic, so advertisers can activate, adjust, and measure ads through a platform with more control over screens, timing, and reporting than traditional OOH media buys, which are typically fixed placements purchased directly from media owners.
Why is high-quality inventory important?
Inventory quality matters because it determines whether a campaign’s ads are shown in the right environment, on the right screens, and to the right audience, with quality standards that support trustworthy reporting, optimization, and outcomes advertisers can defend.
What types of DOOH screens exist?
DOOH advertising runs across screens such as large-format digital billboards, transit displays, retail and place-based networks (gyms, offices, malls), and in-store screens, each offering different location dynamics, audience attention patterns, and environment context for campaigns.
How do agencies evaluate vendor reliability for DOOH inventory?
Agencies look for vendors and media owners that meet clear quality standards, including transparent screen and location lists, proof-of-play, consistent measurement methodology, and programmatic reporting that makes inventory quality and delivery performance easy to validate on a single platform.
Can DOOH campaigns be targeted by the audience?
Yes, many programmatic DOOH campaigns use audience targeting built from location signals, contextual environment data, and privacy-safe modeling, allowing advertisers to align ads to the audience most likely to respond based on where and when screens are viewed.
How do location and environment affect DOOH ads?
Location and environment shape how ads are noticed and interpreted—high-dwell settings can increase attention, fast-moving environments can reduce message retention, and context influences brand fit, so a campaign’s performance often depends as much on the environment as the number of screens.
Have other questions?
If you have more questions, contact us so we can help.

%20Ad.webp)
.svg)
.svg)


OOH%20Metrics%20Explained_%20How%20to%20Measure%20and%20Improve%20Campaign%20Performance%20(1).webp)
%20and%20How%20Does%20It%20Work.webp)