The Problem with Platform-Reported Data: Why You Can’t Trust the Numbers
Mary Gabrielyan
May 19, 2026
16
minutes read
Campaign dashboards and end-of-quarter revenue reports rarely tell the same story. This article explains why platform-reported performance diverges from real business outcomes, and how marketing teams can rebuild measurement on a foundation that connects the two.
A campaign can look like a triumph in the platform's own interface and a disappointment in the company's books. Click-through rates, conversion volumes, and reported return on ad spend all point one way; CRM records, attributed pipeline, and confirmed revenue point another. The gap is not unusual, and it is not the result of careless setup. It is the structural reality of modern marketing effectiveness measurement.
Each ad platform reports performance through its own lens. Google attributes conversions according to its own data, modeling, and rules. Meta does the same on its own terms. A demand-side platform applies its own attribution logic, search platforms apply theirs, and connected TV and out-of-home introduce gaps the click-based ad world was never built to handle. Every marketing performance report arriving on a CMO's desk is, in effect, a partial account written in a different dialect, measuring fragments of a journey rather than the journey itself.
That fragmentation, combined with cookie deprecation, privacy regulation, and a growing reliance on modeled data, sits at the heart of marketing measurement challenges. Decisions about budget allocation, channel prioritization, and growth strategy increasingly rest on inputs that are incomplete, inflated by overlapping attribution, and shaped by each platform's commercial incentives. Without a deliberate effort to validate and unify those inputs into trustworthy marketing intelligence data, even disciplined teams end up optimizing toward the wrong picture.
The sections that follow set out why platform data behaves the way it does, what it costs when leaders trust it uncritically, and how a more reliable measurement approach can be built — one that ties marketing activity back to the business outcomes that actually matter.
Why you can’t trust platform-reported data
Platform dashboards feel reliable because they are designed to feel reliable. The interface is clean, the numbers are precise to the decimal, and the export button is always there. What the interface does not show is everything happening underneath: how each impression was counted, which conversions the platform decided to claim, what was directly observed and what was inferred, and which user actions never made it into the dataset at all.
Marketers see the polished output of a long pipeline they do not control. Every step in that pipeline—collection, attribution, modeling, presentation — is built and tuned by the same company that benefits commercially when its numbers look good. A platform that determines which conversions belong to it, applies its own attribution window, fills in tracking gaps using its own modeling, and presents the result through its own user interface is, in effect, grading its own work.
The path of a reported conversion
That does not make the numbers worthless. Click counts, impressions, and direct response signals are still useful indicators of activity. The problem is treating them as the truth of business performance rather than as one party's account of its own contribution. A platform's reported conversions are best understood as a claim, not a measurement.
The next sections look at why those claims rarely line up — across walled gardens, programmatic, search, and the channels that fall outside the click economy entirely.
⚡ 60–75% of buy-side users of advanced measurement tools say current approaches fall short on rigor, timeliness, trust, or efficiency — and none believe all paid channels are well represented in today's marketing mix models (Source: IAB State of Data 2026)
Why platform marketing data doesn’t match
Performance data differs across ad platforms because each one operates as a closed measurement system with its own rules.
Walled gardens such as Meta and Google control collection, attribution, and reporting end to end inside their own environments, which means advertisers see what those platforms choose to show.
Programmatic demand-side platforms apply their own attribution logic across the open web.
Search engines define clicks, conversions, and assists differently again.
Connected TV and out-of-home introduce a third pattern: aggregated, lower-granularity reporting that resists direct comparison with click-based channels.
The result is a measurement environment where the same campaign produces several legitimate-looking but contradictory accounts of its own performance. A purchase counted by Meta as a Meta-driven conversion may also be counted by Google Ads, by an attribution tool, and by the CRM — each according to its own definition of credit.
Each platform uses its own rules to decide which conversions belong to it, which is why two reports describing the same campaign will rarely agree. Default attribution windows differ. Click-based and view-based credit are weighted differently. Cross-device behavior is handled differently. Some platforms count a conversion if a user saw an ad days earlier and converted on a separate device; others require a click within a tighter window.
Those differences are not bugs. They reflect each platform's view of its own contribution to the customer journey, which means each platform's reported numbers are calibrated to its own commercial story. Add the platforms together and the totals will exceed the true number of conversions, often by a large margin.
Even when two platforms appear to report the same metric, they are often measuring different things.
A "conversion" in one system may include lead form submissions, email signups, and purchases; in another it may be limited to revenue events.
A "click" may be counted on first registered tap or only after a page load.
View-through windows vary.
Some platforms include cross-device conversions by default; others require them to be turned on.
When teams stack these numbers in a single spreadsheet, the comparison feels straightforward but is not. Apparent performance differences between channels can be artifacts of definition rather than real differences in outcome. Standardizing internal definitions before any cross-platform analysis is one of the most common omissions in marketing performance reporting and one of the easiest to correct.
Marketing data loss and modeling
The third reason platform data does not match is that some of the underlying user behavior is no longer being measured at all. Apple's App Tracking Transparency framework, browser-level restrictions on third-party cookies, and privacy regulations across the United States and Europe have collectively reduced the share of user actions that can be observed directly. When the signal disappears, platforms do not return blank fields. They estimate.
⚡ When a platform reports a conversion it didn't directly observe, it isn't lying—it's modeling. The trouble is that the dashboard rarely tells you which is which.
Modeled conversions are calculated from patterns the platform has seen elsewhere and projected onto the gap. The output looks identical to a measured conversion in the interface. Teams optimizing campaigns against those numbers are, increasingly, optimizing against forecasts rather than facts. Modeling itself is not the problem; it is necessary in a privacy-restricted world. The problem is that the modeling is owned, opaque, and absorbed into figures presented as measurement.
The 4 marketing data challenges
Four data problems consistently distort decision-making in marketing teams: fragmentation, missing data, duplication, and modeling. Each shows up in everyday reports in slightly different ways, and each carries a direct business cost when uncorrected.
Fragmentation of marketing data
Marketing data is split across Google, Meta, demand-side platforms, search engines, social platforms, analytics tools, ad servers, customer data platforms, and CRM systems—each with its own schema, identity logic, and reporting cadence. No single source contains the full customer journey, because the journey itself happens across environments that do not share user-level data with each other.
The practical effect on the marketing performance report is that channels are evaluated in isolation. A team can compare last week's Meta spend to last week's Meta conversions, but cannot easily see how a Meta impression interacted with a paid search click and a connected TV ad over the previous fortnight. The journey is visible to the user living it; it is invisible to the team trying to measure it.
This fragmentation is the underlying reason so many later problems exist. Duplication, modeled data, and inconsistent definitions are all easier to spot—and easier to correct—when data is unified. Fragmentation is the structural condition; the rest are symptoms.
The data marketers can see is a subset of the data that used to exist.
App Tracking Transparency restricted user-level signal from iOS apps.
Safari and Firefox have blocked third-party cookies for years;
Chrome has spent years signaling and revising its own deprecation timeline.
The General Data Protection Regulation, the California Consumer Privacy Act, and a growing patchwork of state-level privacy laws have made consent the default condition for data collection.
The cumulative effect is that significant portions of user activity now go unobserved. Cross-device behavior, in particular, is harder to track than at any point in the past decade. When a user discovers a brand on a phone, researches on a tablet, and converts on a desktop, large parts of that path are no longer visible to the platforms involved. Reported performance reflects only the part of reality that survived collection—which means an absence of conversions in a report is not the same as an absence of conversions in the world.
Data inflation and duplication
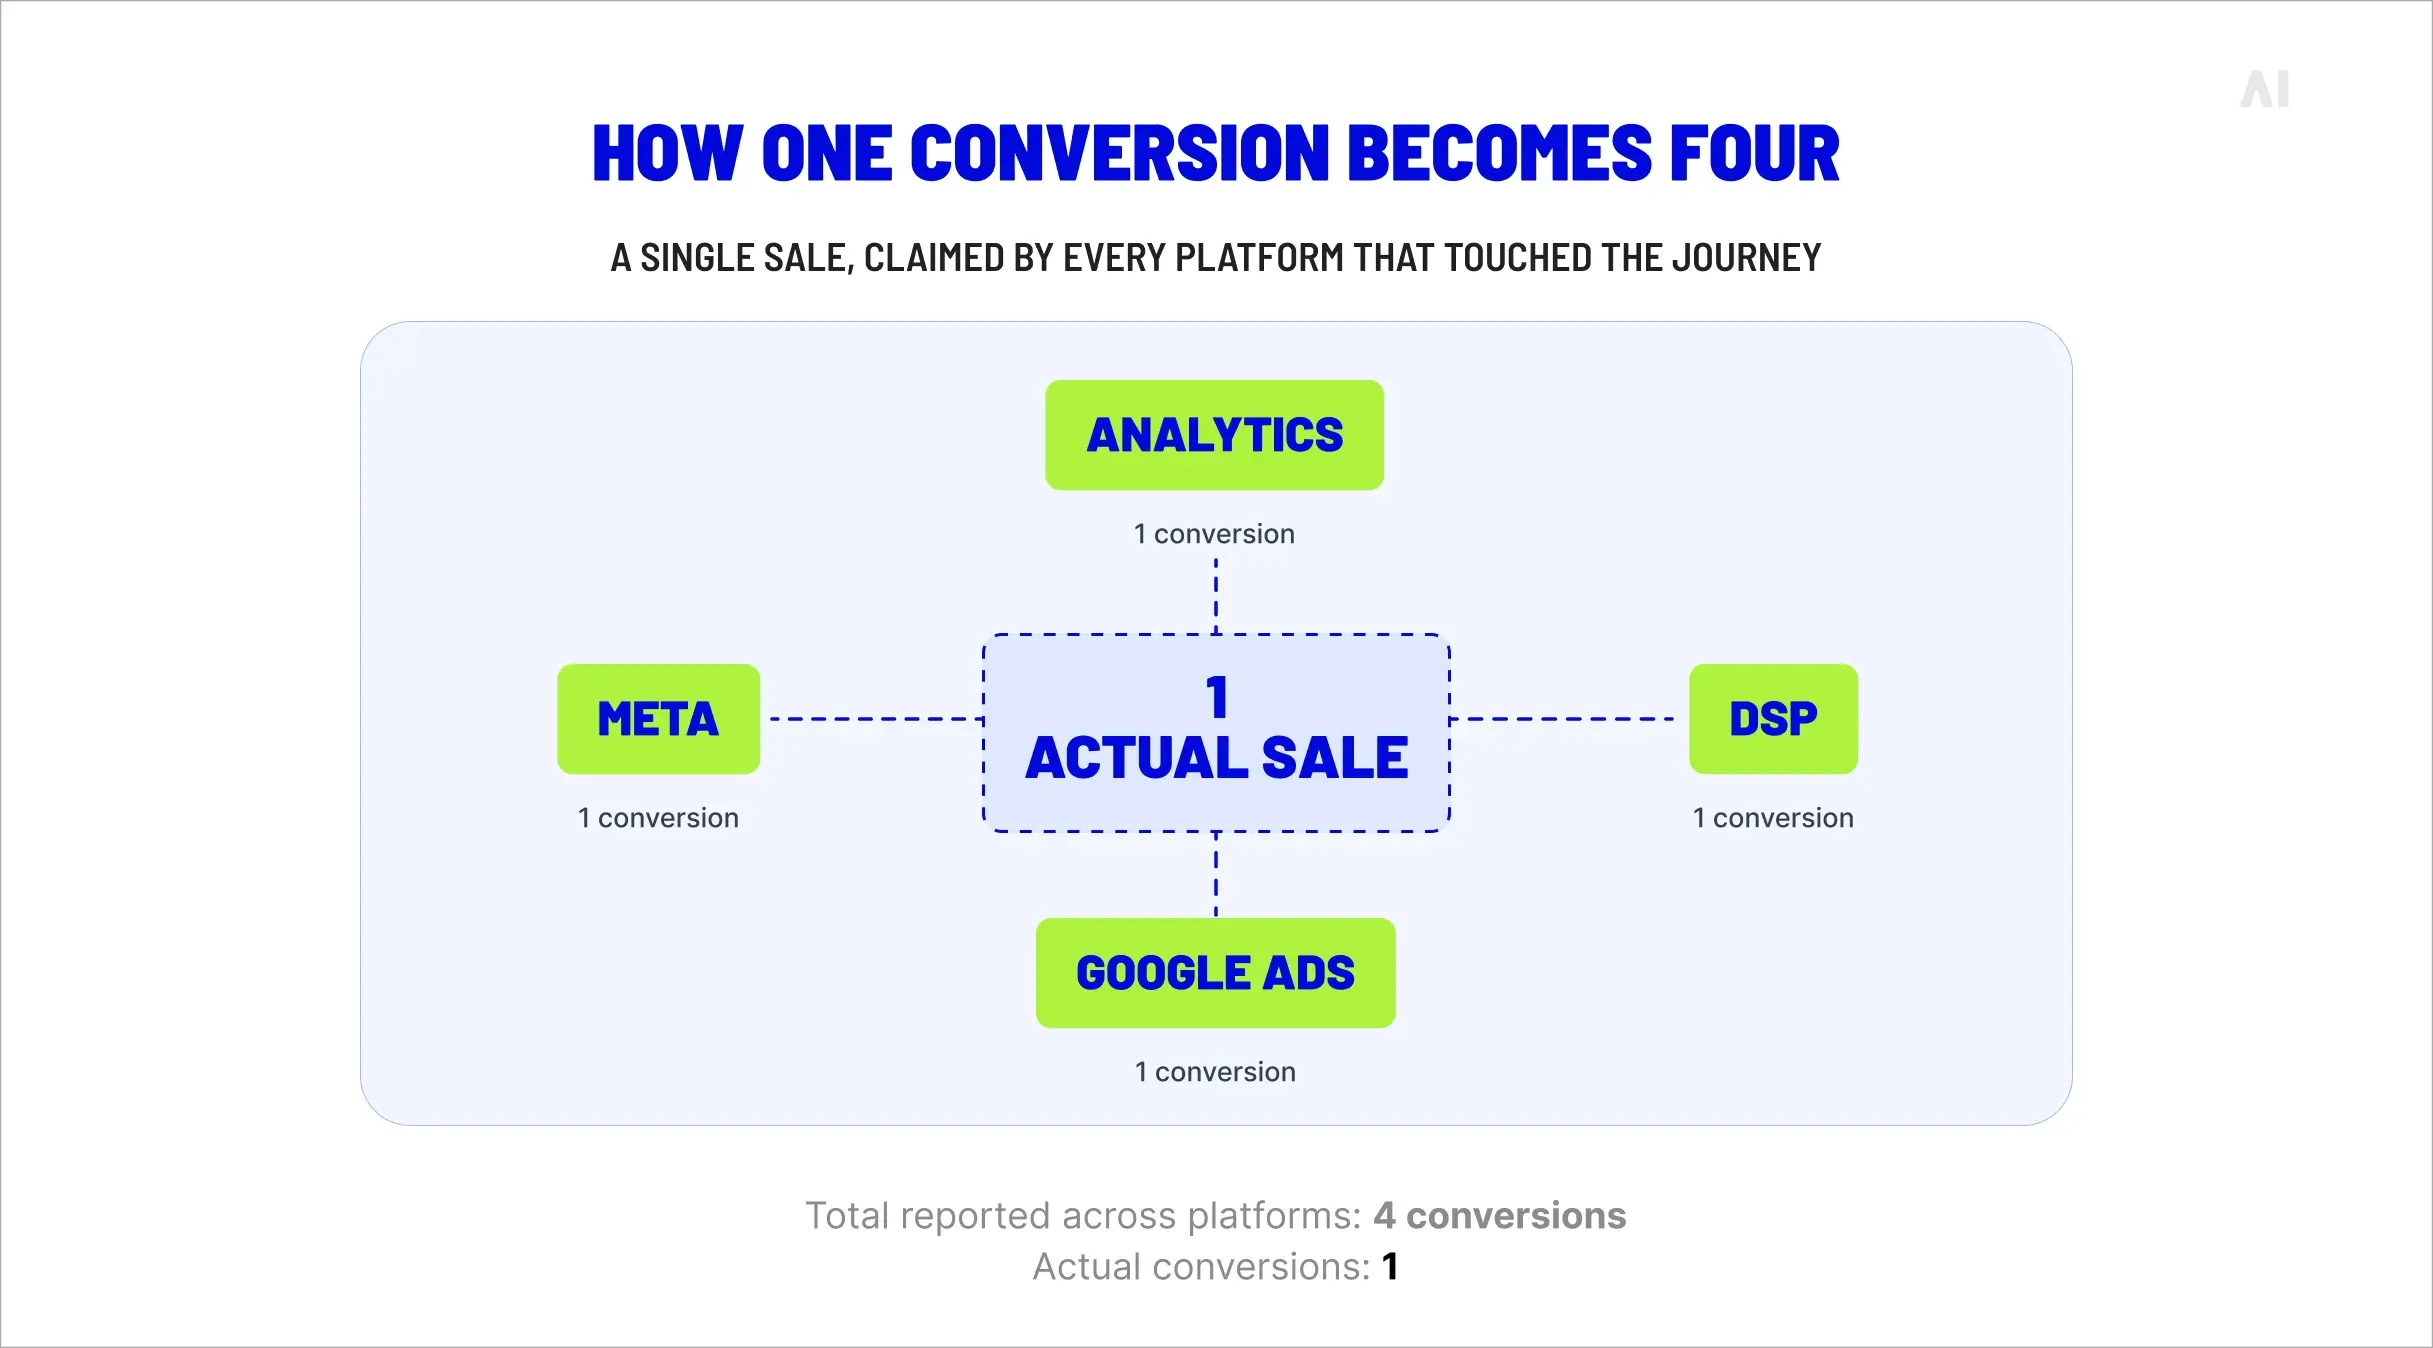
When several platforms each claim credit for the same conversion, the total reported across them exceeds the real conversion count. A purchase that happened once gets counted in Meta, in Google, in a DSP, and in a search platform—each one applying its own attribution rules and each one entitled, by its own logic, to claim the outcome. Stacked side by side, those reports describe a world with more conversions than actually occurred.
How one conversion becomes four
The consequence for marketing ROI measurement challenges is significant: blended ROI calculations built from platform numbers can describe a campaign as profitable when, on a deduplicated revenue basis, it was not. Teams compounding the inflation by reporting the stacked numbers internally end up making real budget decisions on the basis of arithmetic that does not reconcile with finance.
Modeled (estimated) data
When tracking is missing, modeling fills the gap. Most major platforms now use machine learning to estimate conversions that were not directly observed, projecting from patterns seen in users who did opt in, did accept cookies, or were tracked across devices. Modeling is technically necessary; without it, reported performance would collapse alongside the observable signal.
The issue is presentation. Modeled and measured conversions appear in the same column on the same dashboard, with no visible mark separating them. A team reading the number cannot tell, without going looking, whether a given conversion was witnessed or inferred. As the share of modeled data grows, the reported figure drifts further from a measurement and closer to a forecast, but the interface continues to present it as fact.
When a reported number turns out to be largely modelled, it is not a measurement in any meaningful sense. It is a confident estimate, and the confidence belongs to the platform, not to the data.
This matters most in privacy-restricted contexts. Industries with younger or more privacy-aware audiences, or campaigns running heavily on iOS, will have a higher share of modeled conversions than a dashboard suggests. Decisions taken at face value can drift a long way from the underlying reality of customer behavior.
The cost of inaccurate marketing data
Distorted measurement is a financial problem. When budget decisions, channel mix, and strategic priorities are set against numbers that overstate the contribution of some channels and understate others, the company spends real money on the wrong things, and the consequences compound as decisions stack on top of decisions.
The cost shows up in three connected ways:
budget allocated to the wrong channels,
returns reported above the line that revenue cannot support below it, and
a longer-term strategy built on a reading of performance that the underlying business cannot validate.
None of these are visible in the dashboards causing them. They surface in the gap between marketing's reported performance and finance's reported revenue.
⚡ Only 32% of marketers globally measure their media spend holistically across both digital and traditional channels—yet 85% say they are confident in their ability to measure ROI (Source: Nielsen)
Misallocated budget
Spend follows reported performance. When platform reports overstate the contribution of paid social or search because of generous attribution windows and aggressive cross-device matching, those channels attract more investment in the next quarter. Channels with quieter reporting—particularly upper-funnel ones such as connected TV, online video, and audio—show smaller direct response numbers and lose out, even when their contribution to overall outcomes is substantial.
The effect is a slow drift toward channels that report well rather than channels that perform well. Over multiple planning cycles, marketing budgets concentrate around the platforms most willing to claim credit. The drift is rarely visible in any single report; it appears in the cumulative shape of a marketing mix that no longer matches the customer journey it is meant to influence.
Fake marketing ROI
Reported return on ad spend is shaped by attribution rules, view-through windows, and modeled conversions. Real return on ad spend is shaped by money moving through a bank account. The two regularly disagree.
When the gap is small, reported ROI is a useful proxy.
When the gap is large—and inflation, duplication, and modeling can make it large—reported ROI describes a campaign that does not exist.
The risk is the most acute when results are stitched together across platforms. Each platform's claim is internally consistent; combined, they overcount. A leadership team reviewing a deck that totals platform-reported conversions and presents the result as company performance is reading a number that, by construction, cannot reconcile with finance.
Poor strategic decisions
Bad data does not only cause bad tactics. It produces bad strategy. When a leadership team optimizes against reported metrics for long enough, the company learns to value what the platforms value—short attribution windows, last-click credit, narrowly defined conversions—over what the business needs, which is durable customer acquisition and revenue growth.
The strategic damage is hard to reverse. Brand investment is cut because it does not generate reportable conversions. Channels that drive long-term value are starved because their direct response signal is small. New product launches are evaluated against frameworks built for the previous mix. By the time the underlying revenue picture catches up, several quarters of momentum have usually been lost.
Fast check: Recognize unreliable data
Several patterns indicate that a marketing performance report is not telling the full story.
Inconsistent results across platforms for the same campaign—where Meta, Google, and the CRM each report a different number of conversions—are the most common signal.
Performancethat looks unrealistically stable, with weekly variance that never matches the variance in the rest of the business, often points to heavy modeling.
An inability to connect marketing results to actual revenue, where finance and marketing tell different stories about the same period, is the clearest warning.
So is a noticeable shift in reported performance every time an attribution setting is adjusted, which suggests the numbers are more sensitive to configuration than to the campaign itself.
None of these patterns prove that data is wrong. They indicate that a closer look is worthwhile before the next budget decision is made.
How to validate your marketing data
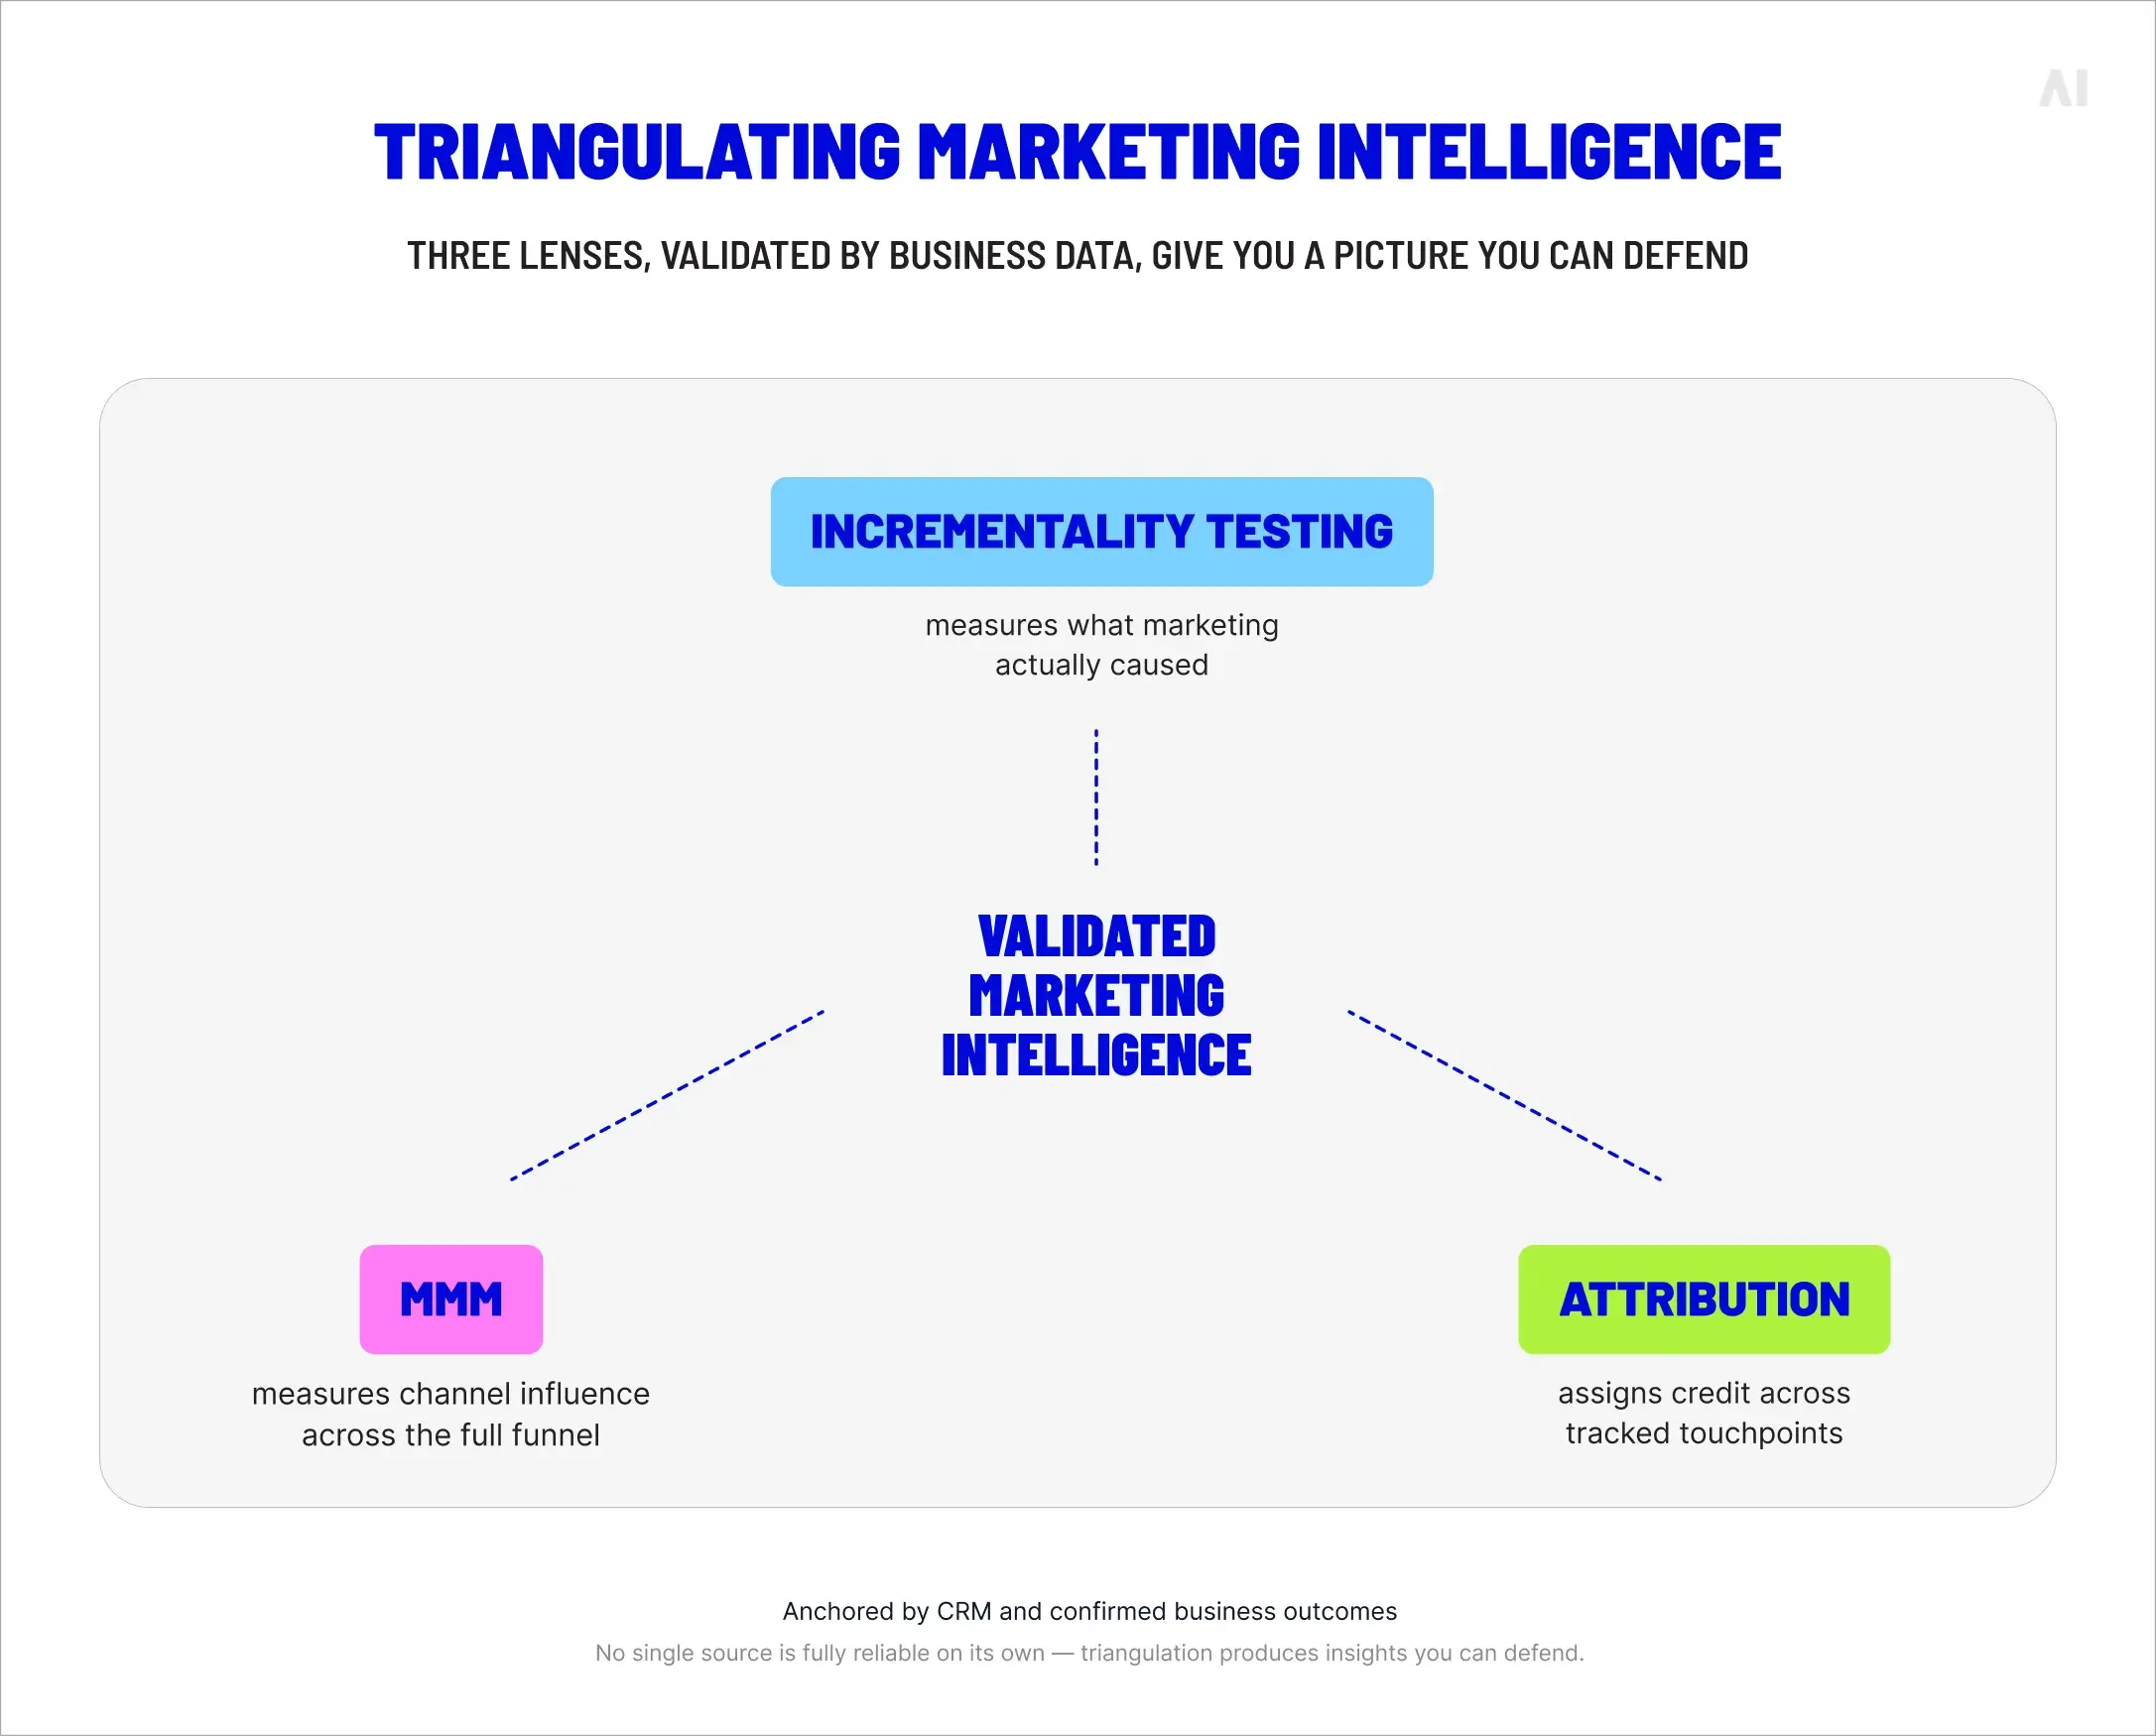
Validating marketing data means treating platform-reported numbers as one input among several, rather than the answer in itself. No single source—including the CRM—is fully reliable on its own. Trustworthy insights come from cross-checking what platforms report against what the business actually records, testing what marketing actually causes rather than what it gets credit for, and comparing data across platforms to surface inconsistencies before they shape a decision.
The goal is not to replace platform data but to put it in context. A reported conversion that aligns with a logged sale, an incrementality test, and a corroborating signal from a second platform is meaningfully different from a reported conversion that exists only on one dashboard. Validation is the discipline of telling those two cases apart.
Backend systems are the closest thing to a ground truth in most businesses. CRM records, order management systems, payment processors, and internal analytics all reflect events that actually happened—orders shipped, invoices paid, accounts opened. Platform-reported conversions should be reconciled against those records as a matter of routine, not as a one-off audit.
The exercise often surfaces structural overcounting. A platform reporting a hundred conversions against fifty logged sales in the same period is not necessarily wrong, but it is making attribution claims the business cannot validate. Closing that loop—by matching reported conversions to confirmed transactions wherever possible, and treating the unmatched share as a known unknown—turns dashboards from declarative statements into testable hypotheses.
Test incrementality, not just attribution
Attribution assigns credit. Incrementality measures cause. The two are easy to confuse and substantially different. A channel that receives a lot of attributed credit may be capturing demand that would have converted anyway; a channel that receives little credit may be generating new demand that converts elsewhere. Only an incrementality test can distinguish between them.
The most reliable approach is structured experimentation:
A/B tests where comparable audiences are exposed and not exposed to a campaign,
geographic holdouts where matched markets receive different treatments, or
audience holdouts within targeting platforms.
Each method produces a different type of evidence. None is perfect—geo tests struggle with small markets, holdouts are hard to maintain over long campaigns—but all of them measure something attribution cannot: what would have happened without the campaign. That counterfactual is the difference between knowing what marketing was credited with and knowing what marketing actually caused.
Cross-check data across platforms
Comparing reported performance across walled gardens, demand-side platforms, search platforms, and analytics tools tends to expose discrepancies that no single dashboard would reveal. When Meta, Google, and an analytics suite report meaningfully different numbers for the same period, the disagreement itself is information—usually pointing to attribution differences, modeling assumptions, or definition mismatches that can be investigated and at least partly resolved.
Television and out-of-home complicate the picture. Both report at lower granularity than digital channels—typically at audience or panel level rather than per impression—and use different methodologies entirely. They cannot be cross-checked in the same way as click-based channels. The best approach is to acknowledge the seam, use TV and out-of-home data for what it does measure well (reach, frequency, audience composition), and treat any digital uplift in the periods they run as a triangulation point rather than a direct comparison.
The shift that matters is from raw platform reporting to marketing intelligence data: information that has been unified across sources, validated against the business, and connected back to the outcomes the business cares about. Intelligence is what platform data becomes once it has been put through a process the platform itself cannot perform—combined with other platforms, reconciled with backend systems, and held to the question of what it actually proves.
Triangulating marketing intelligence
That shift is partly technological and partly cultural.
Technologically, it requires the ability to bring data together across walled gardens, programmatic, search, analytics, CRM, and offline channels in a form that supports comparison.
Culturally, it requires teams to stop treating any single dashboard as authoritative and to start treating measurement as a process of triangulation.
The reward is decisions made on inputs the business can defend—to the CFO, to the board, and to itself.
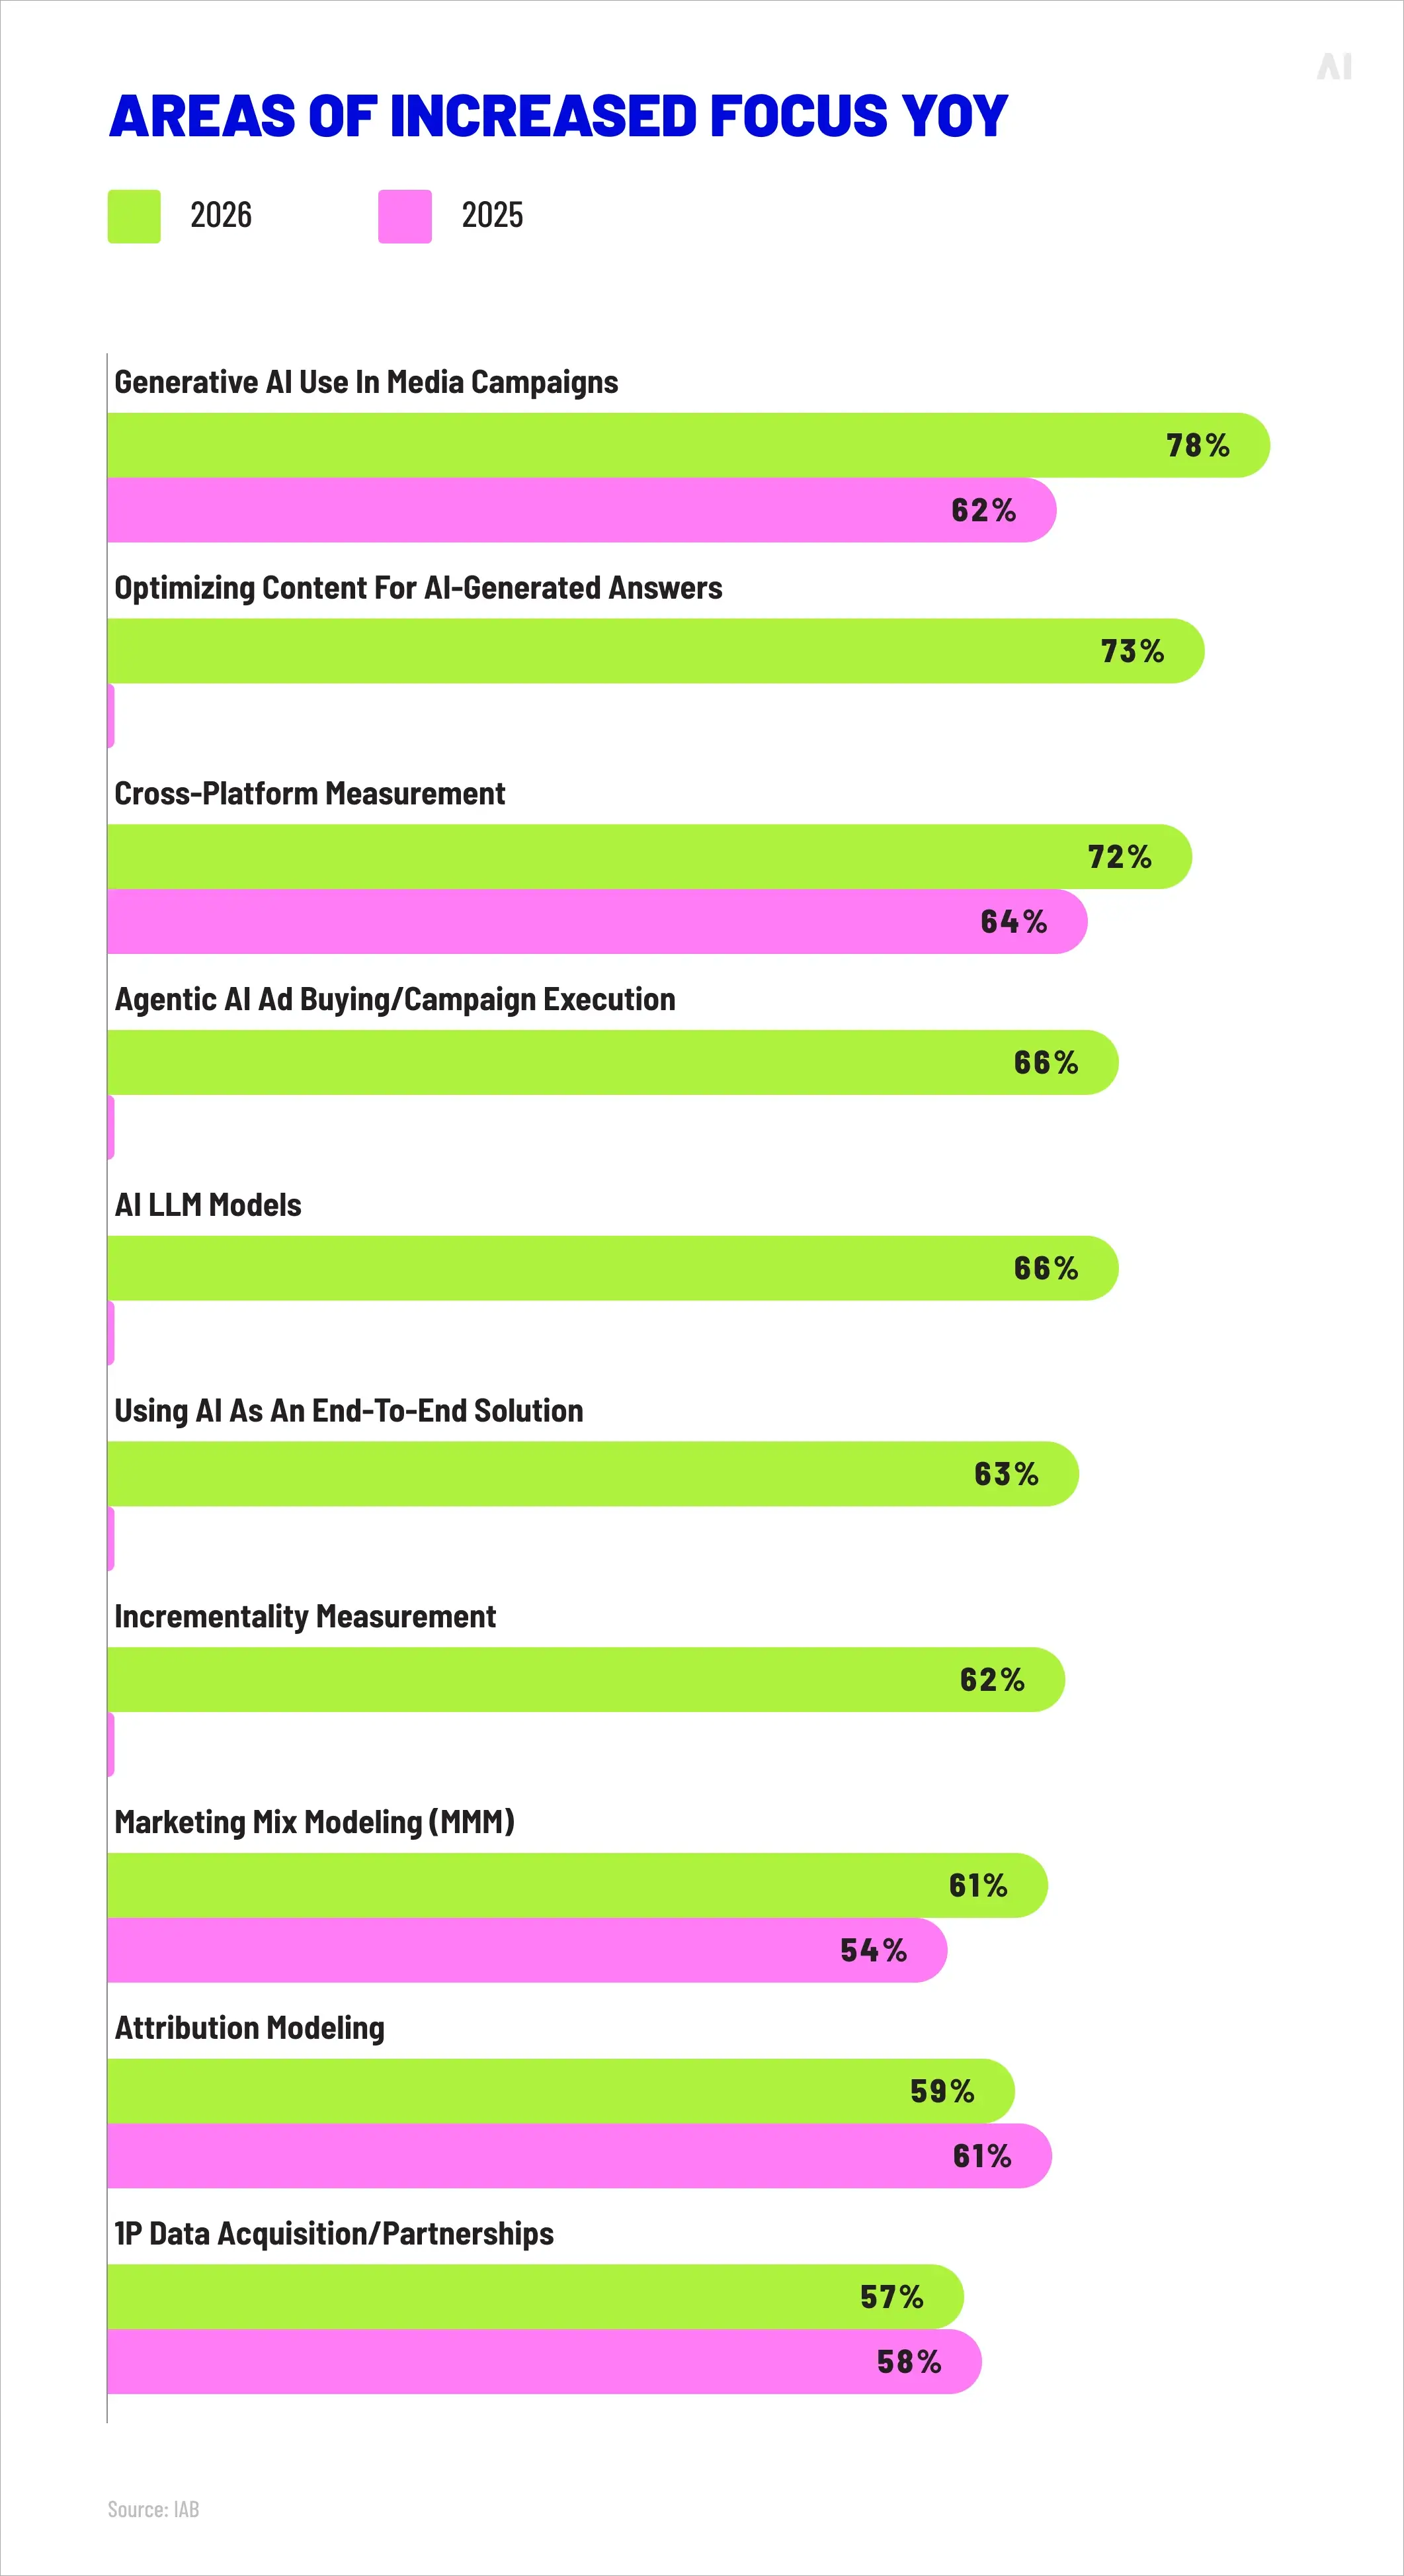
Marketers' top measurement investment priorities, 2026 (Source)
How to improve marketing performance with better data
Better data improves performance because it improves decisions. Validated and consistent inputs let teams allocate budget toward what is actually working, prioritize channels that deserve prioritization, and scale activity that drives outcomes the business can measure on its own terms. The five steps below describe a practical path from platform reporting to the kind of unified, validated, action-ready data that supports stronger marketing effectiveness measurement metrics—and stronger results.
1. Unify data across platforms
Bringing data together across walled gardens, programmatic platforms, search, analytics tools, and offline channels is the foundation of every improvement that follows. Without unification, every other discipline—standardization, triangulation, validation—has to be done piecemeal and partial, and the gaps left behind are exactly where bad decisions tend to come from.
Unified data does not mean a single perfect dataset. It means a deliberate architecture in which sources are connected, identifiable through consistent keys where possible, and comparable in the ways that matter. AI Digital's Open Garden Framework is built around this principle: a vendor-neutral approach that connects across more than fifteen demand-side platforms and the wider digital ecosystem, so advertisers can see and act on cross-channel performance without being limited to any single platform's view of itself. The point is not to replace platform reporting but to set it in a context that makes it usable.
Consistent definitions are unglamorous and decisive. Teams need shared answers to deceptively basic questions: what counts as a conversion, what counts as a qualified lead, how revenue is attributed across touchpoints, which window a campaign is being judged against. When those definitions vary between teams, agencies, and platforms, every cross-channel comparison embeds confusion before any analysis begins.
Standardization is best treated as a governance exercise rather than a documentation one. A definitions document on a shared drive does not enforce itself. Building shared metric definitions into reporting templates, dashboards, and briefing processes—and reviewing them as the business changes—is how standardization survives contact with the reality of running campaigns.
3. Combine attribution, MMM, and incrementality
No single measurement method gives a complete picture. Each one answers a different question, has a different blind spot, and is more or less useful in different contexts. Combining them—rather than choosing one—produces the most balanced view of performance.
How marketers are augmenting their measurement strategy (Source)
Using all three reduces the risk that any single bias dominates the conclusion. AI Digital's Elevate platform brings them together in one workflow, combining attribution, marketing mix modeling, and incrementality analysis with research, planning, optimization, and reporting across the wider digital ecosystem. The aim is not to multiply tools but to give marketing teams a coherent place from which to triangulate.
Better measurement starts with better inputs. Low-quality inventory, fraudulent traffic, made-for-arbitrage sites, and inefficient supply paths all distort performance data before it ever reaches a dashboard. A campaign that runs against fraudulent or non-viewable inventory will generate impressions, clicks, and apparent engagement that have no relationship to real customer behavior—which means even perfectly executed measurement downstream is being applied to a corrupted signal.
Cleaning the source means selecting inventory carefully, filtering out low-value publishers, removing invalid traffic, and shortening the supply path between buyer and publisher. AI Digital's Smart Supply approaches this through curated supply selection across more than nine supply-side platforms, applying brand-safety controls and supply path optimization tailored to client KPIs. Better inputs do not solve every measurement problem, but they remove a layer of distortion that no amount of analytical sophistication further down the chain can correct for.
Validated data only creates value when it actively shapes campaigns. The classic failure mode is a sophisticated measurement function that produces clear insights at month-end while media buying carries on against the same platform-reported metrics it always did. Insight that is not connected to execution drifts into the background; the campaign continues to run on the data it can see in real time.
Closing the loop means feeding validated and triangulated insights back into bidding strategy, audience selection, creative rotation, and budget reallocation as quickly as the medium allows. The faster the loop, the more decisions are made against the better picture rather than the platform's picture. That, in the end, is what better data is for: not better reports, but better next moves.
Take control of your marketing data and decisions
The shift from platform-reported metrics to validated, connected, business-aligned measurement is the most consequential change a marketing team can make to the quality of its decisions. It does not require abandoning platform data, which remains a useful operational signal. It requires putting that data in its place—as one input among several, rather than the source of truth—and building the validation, triangulation, and unification practices that turn it into something the business can act on with confidence.
AI Digital works with brands and agencies on every step of that shift.
Our managed service handles end-to-end campaign execution across more than fifteen demand-side platforms, with the transparency and DSP-agnostic approach the modern measurement environment demands.
The Open Garden Framework connects performance data across the wider digital ecosystem rather than locking it inside any single walled garden.
Elevate unifies research, planning, optimization, and reporting in one marketing intelligence platform, combining attribution, marketing mix modeling, and incrementality in a single workflow.
Smart Supply cleans the input data by curating premium, brand-safe inventory and shortening supply paths to where the spend actually works.
If platform data is no longer giving you a reliable picture of how your marketing is performing, get in touch. We can help you build a measurement approach that ties what you spend to what your business actually earns.
Blind spot
Key issues
Business impact
AI Digital solution
Lack of transparency in AI models
• Platforms own AI models and train on proprietary data • Brands have little visibility into decision-making • "Walled gardens" restrict data access
• Inefficient ad spend • Limited strategic control • Eroded consumer trust • Potential budget mismanagement
Open Garden framework providing: • Complete transparency • DSP-agnostic execution • Cross-platform data & insights
Optimizing ads vs. optimizing impact
• AI excels at short-term metrics but may struggle with brand building • Consumers can detect AI-generated content • Efficiency might come at cost of authenticity
• Short-term gains at expense of brand health • Potential loss of authentic connection • Reduced effectiveness in storytelling
Smart Supply offering: • Human oversight of AI recommendations • Custom KPI alignment beyond clicks • Brand-safe inventory verification
The illusion of personalization
• Segment optimization rebranded as personalization • First-party data infrastructure challenges • Personalization vs. surveillance concerns
• Potential mismatch between promise and reality • Privacy concerns affecting consumer trust • Cost barriers for smaller businesses
Elevate platform features: • Real-time AI + human intelligence • First-party data activation • Ethical personalization strategies
AI-Driven efficiency vs. decision-making
• AI shifting from tool to decision-maker • Black box optimization like Google Performance Max • Human oversight limitations
• Strategic control loss • Difficulty questioning AI outputs • Inability to measure granular impact • Potential brand damage from mistakes
Managed Service with: • Human strategists overseeing AI • Custom KPI optimization • Complete campaign transparency
Fig. 1. Summary of AI blind spots in advertising
Dimension
Walled garden advantage
Walled garden limitation
Strategic impact
Audience access
Massive, engaged user bases
Limited visibility beyond platform
Reach without understanding
Data control
Sophisticated targeting tools
Data remains siloed within platform
Fragmented customer view
Measurement
Detailed in-platform metrics
Inconsistent cross-platform standards
Difficult performance comparison
Intelligence
Platform-specific insights
Limited data portability
Restricted strategic learning
Optimization
Powerful automated tools
Black-box algorithms
Reduced marketer control
Fig. 2. Strategic trade-offs in walled garden advertising.
Core issue
Platform priority
Walled garden limitation
Real-world example
Attribution opacity
Claiming maximum credit for conversions
Limited visibility into true conversion paths
Meta and TikTok's conflicting attribution models after iOS privacy updates
Data restrictions
Maintaining proprietary data control
Inability to combine platform data with other sources
Amazon DSP's limitations on detailed performance data exports
Cross-channel blindspots
Keeping advertisers within ecosystem
Fragmented view of customer journey
YouTube/DV360 campaigns lacking integration with non-Google platforms
Black box algorithms
Optimizing for platform revenue
Reduced control over campaign execution
Self-serve platforms using opaque ML models with little advertiser input
Performance reporting
Presenting platform in best light
Discrepancies between platform-reported and independently measured results
Consistently higher performance metrics in platform reports vs. third-party measurement
Fig. 1. The Walled garden misalignment: Platform interests vs. advertiser needs.
Key dimension
Challenge
Strategic imperative
ROAS volatility
Softer returns across digital channels
Shift from soft KPIs to measurable revenue impact
Media planning
Static plans no longer effective
Develop agile, modular approaches adaptable to changing conditions
Brand/performance
Traditional division dissolving
Create full-funnel strategies balancing long-term equity with short-term conversion
Capability
Key features
Benefits
Performance data
Elevate forecasting tool
• Vertical-specific insights • Historical data from past economic turbulence • "Cascade planning" functionality • Real-time adaptation
• Provides agility to adjust campaign strategy based on performance • Shows which media channels work best to drive efficient and effective performance • Confident budget reallocation • Reduces reaction time to market shifts
• Dataset from 10,000+ campaigns • Cuts response time from weeks to minutes
• Reaches people most likely to buy • Avoids wasted impressions and budgets on poor-performing placements • Context-aligned messaging
• 25+ billion bid requests analyzed daily • 18% improvement in working media efficiency • 26% increase in engagement during recessions
Full-funnel accountability
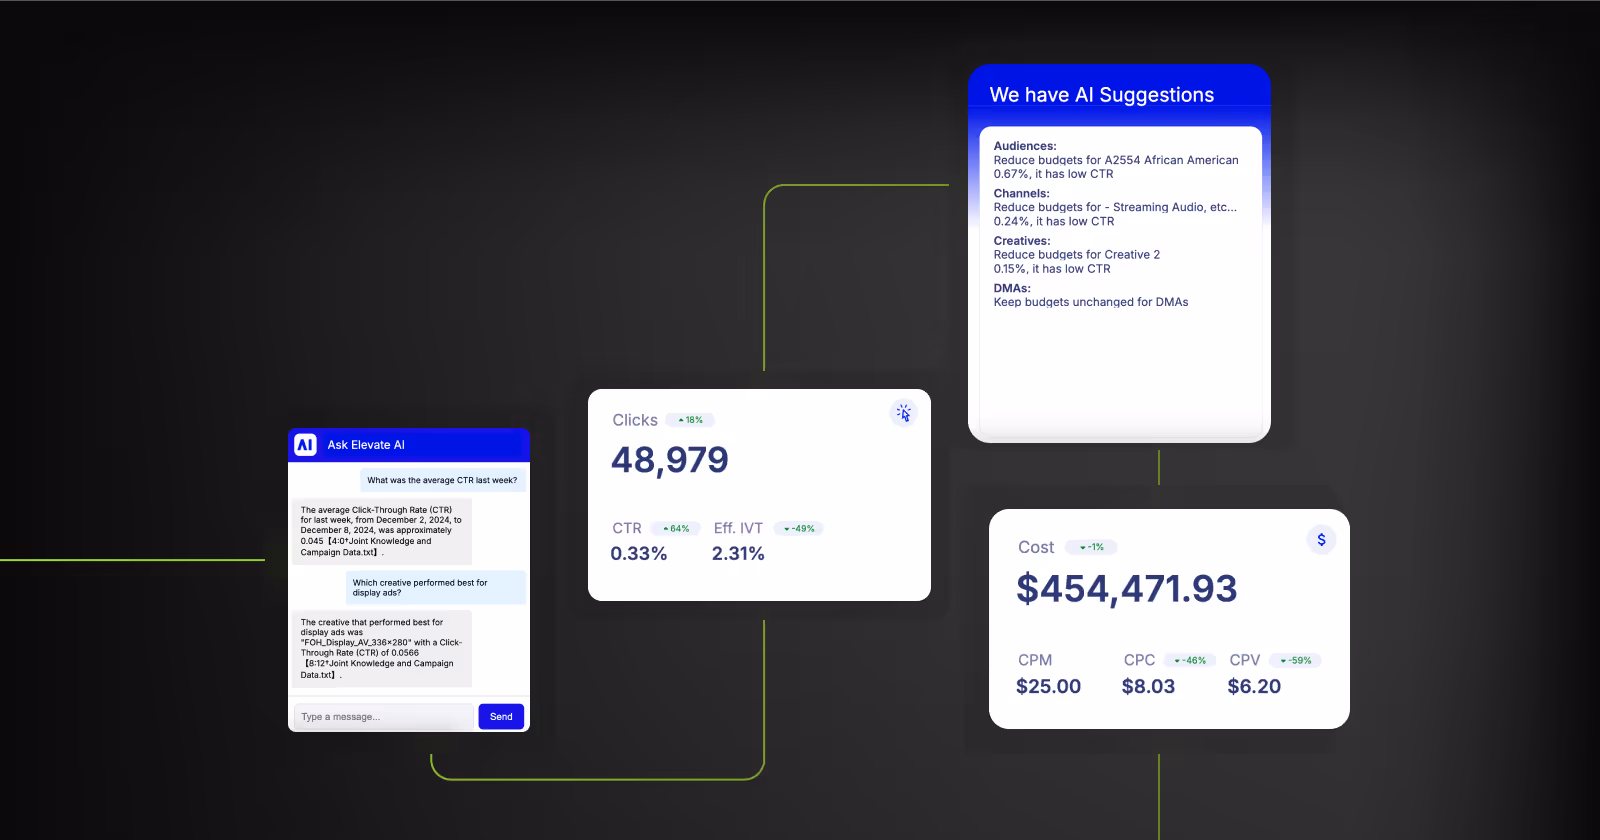
• Links awareness campaigns to lower funnel outcomes • Tests if ads actually drive new business • Measures brand perception changes • "Ask Elevate" AI Chat Assistant
• Upper-funnel to outcome connection • Sentiment shift tracking • Personalized messaging • Helps balance immediate sales vs. long-term brand building
• Natural language data queries • True business impact measurement
Open Garden approach
• Cross-platform and channel planning • Not locked into specific platforms • Unified cross-platform reach • Shows exactly where money is spent
• Reduces complexity across channels • Performance-based ad placement • Rapid budget reallocation • Eliminates platform-specific commitments and provides platform-based optimization and agility
• Coverage across all inventory sources • Provides full visibility into spending • Avoids the inability to pivot across platform as you’re not in a singular platform
Fig. 1. How AI Digital helps during economic uncertainty.
Trend
What it means for marketers
Supply & demand lines are blurring
Platforms from Google (P-Max) to Microsoft are merging optimization and inventory in one opaque box. Expect more bundled “best available” media where the algorithm, not the trader, decides channel and publisher mix.
Walled gardens get taller
Microsoft’s O&O set now spans Bing, Xbox, Outlook, Edge and LinkedIn, which just launched revenue-sharing video programs to lure creators and ad dollars. (Business Insider)
Retail & commerce media shape strategy
Microsoft’s Curate lets retailers and data owners package first-party segments, an echo of Amazon’s and Walmart’s approaches. Agencies must master seller-defined audiences as well as buyer-side tactics.
AI oversight becomes critical
Closed AI bidding means fewer levers for traders. Independent verification, incrementality testing and commercial guardrails rise in importance.
Fig. 1. Platform trends and their implications.
Metric
Connected TV (CTV)
Linear TV
Video Completion Rate
94.5%
70%
Purchase Rate After Ad
23%
12%
Ad Attention Rate
57% (prefer CTV ads)
54.5%
Viewer Reach (U.S.)
85% of households
228 million viewers
Retail Media Trends 2025
Access Complete consumer behaviour analyses and competitor benchmarks.
Identify and categorize audience groups based on behaviors, preferences, and characteristics
Michaels Stores: Implemented a genAI platform that increased email personalization from 20% to 95%, leading to a 41% boost in SMS click through rates and a 25% increase in engagement.
Estée Lauder: Partnered with Google Cloud to leverage genAI technologies for real-time consumer feedback monitoring and analyzing consumer sentiment across various channels.
High
Medium
Automated ad campaigns
Automate ad creation, placement, and optimization across various platforms
Showmax: Partnered with AI firms toautomate ad creation and testing, reducing production time by 70% while streamlining their quality assurance process.
Headway: Employed AI tools for ad creation and optimization, boosting performance by 40% and reaching 3.3 billion impressions while incorporating AI-generated content in 20% of their paid campaigns.
High
High
Brand sentiment tracking
Monitor and analyze public opinion about a brand across multiple channels in real time
L’Oréal: Analyzed millions of online comments, images, and videos to identify potential product innovation opportunities, effectively tracking brand sentiment and consumer trends.
Kellogg Company: Used AI to scan trending recipes featuring cereal, leveraging this data to launch targeted social campaigns that capitalize on positive brand sentiment and culinary trends.
High
Low
Campaign strategy optimization
Analyze data to predict optimal campaign approaches, channels, and timing
DoorDash: Leveraged Google’s AI-powered Demand Gen tool, which boosted its conversion rate by 15 times and improved cost per action efficiency by 50% compared with previous campaigns.
Kitsch: Employed Meta’s Advantage+ shopping campaigns with AI-powered tools to optimize campaigns, identifying and delivering top-performing ads to high-value consumers.
High
High
Content strategy
Generate content ideas, predict performance, and optimize distribution strategies
JPMorgan Chase: Collaborated with Persado to develop LLMs for marketing copy, achieving up to 450% higher clickthrough rates compared with human-written ads in pilot tests.
Hotel Chocolat: Employed genAI for concept development and production of its Velvetiser TV ad, which earned the highest-ever System1 score for adomestic appliance commercial.
High
High
Personalization strategy development
Create tailored messaging and experiences for consumers at scale
Stitch Fix: Uses genAI to help stylists interpret customer feedback and provide product recommendations, effectively personalizing shopping experiences.
Instacart: Uses genAI to offer customers personalized recipes, mealplanning ideas, and shopping lists based on individual preferences and habits.
Medium
Medium
Share article
Url copied to clipboard
No items found.
Subscribe to our Newsletter
THANK YOU FOR YOUR SUBSCRIPTION
Oops! Something went wrong while submitting the form.
Questions? We have answers
Why do platform-reported numbers never match?
Each platform applies its own attribution rules, conversion definitions, attribution windows, and modeling assumptions, and each operates as a closed system that cannot see what other platforms have measured. Two platforms reporting on the same campaign are answering slightly different questions, then claiming credit for outcomes that may overlap. Combined with privacy-driven data loss and increasing reliance on modeled conversions, the structural result is that totals across platforms exceed the real number of conversions and rarely reconcile with the CRM.
Which marketing platform data is the most reliable?
No single platform is reliable on its own, because every platform is grading its own contribution. Backend systems—CRM records, order management, payment processors—are closer to ground truth for outcomes the business cares about, but they cannot tell you which marketing activity caused those outcomes. The most reliable approach is to combine sources: platform data for activity-level signal, backend systems for confirmed outcomes, and incrementality testing for causation.
What are the biggest digital marketing ROI measurement challenges in 2026?
The biggest digital marketing ROI measurement challenges fall into four categories, all of them structural rather than technical. The first is fragmentation: marketing data is split across walled gardens, demand-side platforms, search, analytics tools, and CRM systems, none of which share a common view of the customer journey. The second is signal loss from privacy regulations, cookie deprecation, and App Tracking Transparency, which has reduced the share of user behavior that can be observed directly. The third is modeled data—platforms increasingly fill those tracking gaps with estimates rather than measurements, and present the two identically in dashboards. The fourth is attribution overlap, where multiple platforms claim credit for the same conversion, inflating combined ROI calculations beyond what real revenue can support. Each of these challenges undermines the link between reported performance and actual business outcomes, which is why the most reliable measurement programs combine attribution, marketing mix modeling, and incrementality testing rather than relying on any single source.
Why is attribution data often wrong or misleading?
Attribution assigns credit; it does not measure cause. Most attribution models—last-touch, first-touch, even data-driven—describe the order of touchpoints rather than the impact of those touchpoints on the decision to convert. They are also sensitive to model choice, attribution window, and the data the platform happened to collect. The result is credit assignments that are internally consistent but commercially questionable, and that often disagree across platforms reporting on the same conversion.
How much of marketing data is modeled vs. real?
The share of modeled data has been growing as third-party cookies decline, mobile tracking is restricted, and privacy regulations expand. Major platforms now use modeling to fill gaps wherever directly observed signal is missing—particularly for iOS users, cross-device behavior, and view-through conversions. The exact share varies by platform, channel, and audience, but the practical reality is that modeled and measured conversions appear identically in dashboards. Teams should assume a meaningful proportion of any reported conversion total is estimated rather than observed.
Why does reported ROI not match actual revenue?
Reported return on ad spend is calculated using each platform's attribution rules and modeled conversions, while actual revenue is recorded in the CRM, accounting system, or payment processor. The two diverge for three main reasons: platforms claim credit for outcomes they did not solely cause, the same conversion can be counted by several platforms, and modeled conversions inflate totals beyond what the business actually banked. When platform-reported ROI is high but finance reports modest revenue growth, the gap is the size of the measurement problem.
How can I check if my marketing data is accurate?
Start by reconciling reported conversions against confirmed transactions in the CRM for a defined period. Then look for the patterns that signal unreliable data: large discrepancies between platforms, performance that looks unrealistically stable, or numbers that shift significantly when an attribution setting is changed. Run an incrementality test on a meaningful channel to see whether reported credit reflects real impact. If reported figures, business records, and incrementality results agree, the data is broadly trustworthy. If they disagree, the disagreement itself is the most useful information.
Have other questions?
If you have more questions, contact us so we can help.


.svg)
.svg)


.avif)