The hardest question in B2B marketing is not which campaign performed best, but which one actually moved a deal that took eleven months and a dozen people to close. This article examines the attribution models that hold up under long B2B sales cycles, where each one misleads in its own direction, and how to build a measurement system that informs budget decisions instead of flattering them.
B2B marketing attribution has always been an exercise in approximation, but the approximation has gotten harder to defend. A consumer buys a pair of shoes in an afternoon; a procurement committee buys an enterprise platform over the better part of a year, after dozens of meetings, a security review, three competing internal agendas, and a conversation in a private Slack channel that no analytics tool will ever record. The models most teams use to credit marketing for that purchase were built for the shoes.
The cost of the mismatch is not abstract. When attribution misreads what influenced a deal, the budget follows the misreading. Channels that intercept buyers late get rewarded; channels that created the demand months earlier get cut. Over a few planning cycles, a company can systematically defund the very work that fills its pipeline, all while its dashboards glow green.
This is a practical guide to choosing better. It covers why standard attribution breaks down in long, multi-stakeholder B2B cycles, what each major model actually measures and where each fails, how to match a model to your deal volume and data maturity, and how to extend attribution with incrementality testing and marketing mix modeling when correlation alone stops being good enough. The goal throughout is not perfect measurement, which does not exist in B2B, but measurement reliable enough to allocate money against.
Why standard attribution breaks down in long B2B sales cycles
Attribution models inherited from consumer marketing assume a single identifiable person travelling a roughly linear path to a conversion that happens within a few weeks. B2B violates all three assumptions at once. The buyer is a committee, the path is non-linear and largely invisible, and the conversion can sit eight months past the touchpoint that mattered. Each of these is a structural problem, not a tuning problem, which is why better software rarely fixes it on its own.
Multiple stakeholders, one deal
A modern B2B purchase is a group decision recorded as an individual one. According to Forrester's State of Business Buying, 2026, drawn from its 2025 Buyers' Journey Survey, an average of 13 internal stakeholders and nine external participants now influence a single B2B purchase decision. Gartner's research on complex purchases puts the core buying group at six to ten decision-makers, each arriving with their own independently gathered research. The CRM, almost always, files the whole thing under one contact.
That collapse is where credit goes missing. The economic buyer who read a thought-leadership piece, the IT lead who watched a technical webinar, the procurement manager who compared you against two rivals on a review site, the legal reviewer who never touched marketing at all, are all funneled into a single opportunity record attached to whichever contact happened to fill in the demo form. Every channel that reached the other stakeholders becomes invisible. The model is not measuring the deal; it is measuring one person's slice of it and crediting that slice as the whole.
The distortion is directional. Channels aimed at senior or technical stakeholders, who rarely self-identify through a form, are undercredited by default, while bottom-of-funnel channels that catch the form-filler look stronger than they are. Decisions made on that basis steadily starve the upper funnel.
⚡ When a buying committee of twenty is recorded as a single contact, attribution stops measuring the deal and starts measuring the paperwork.
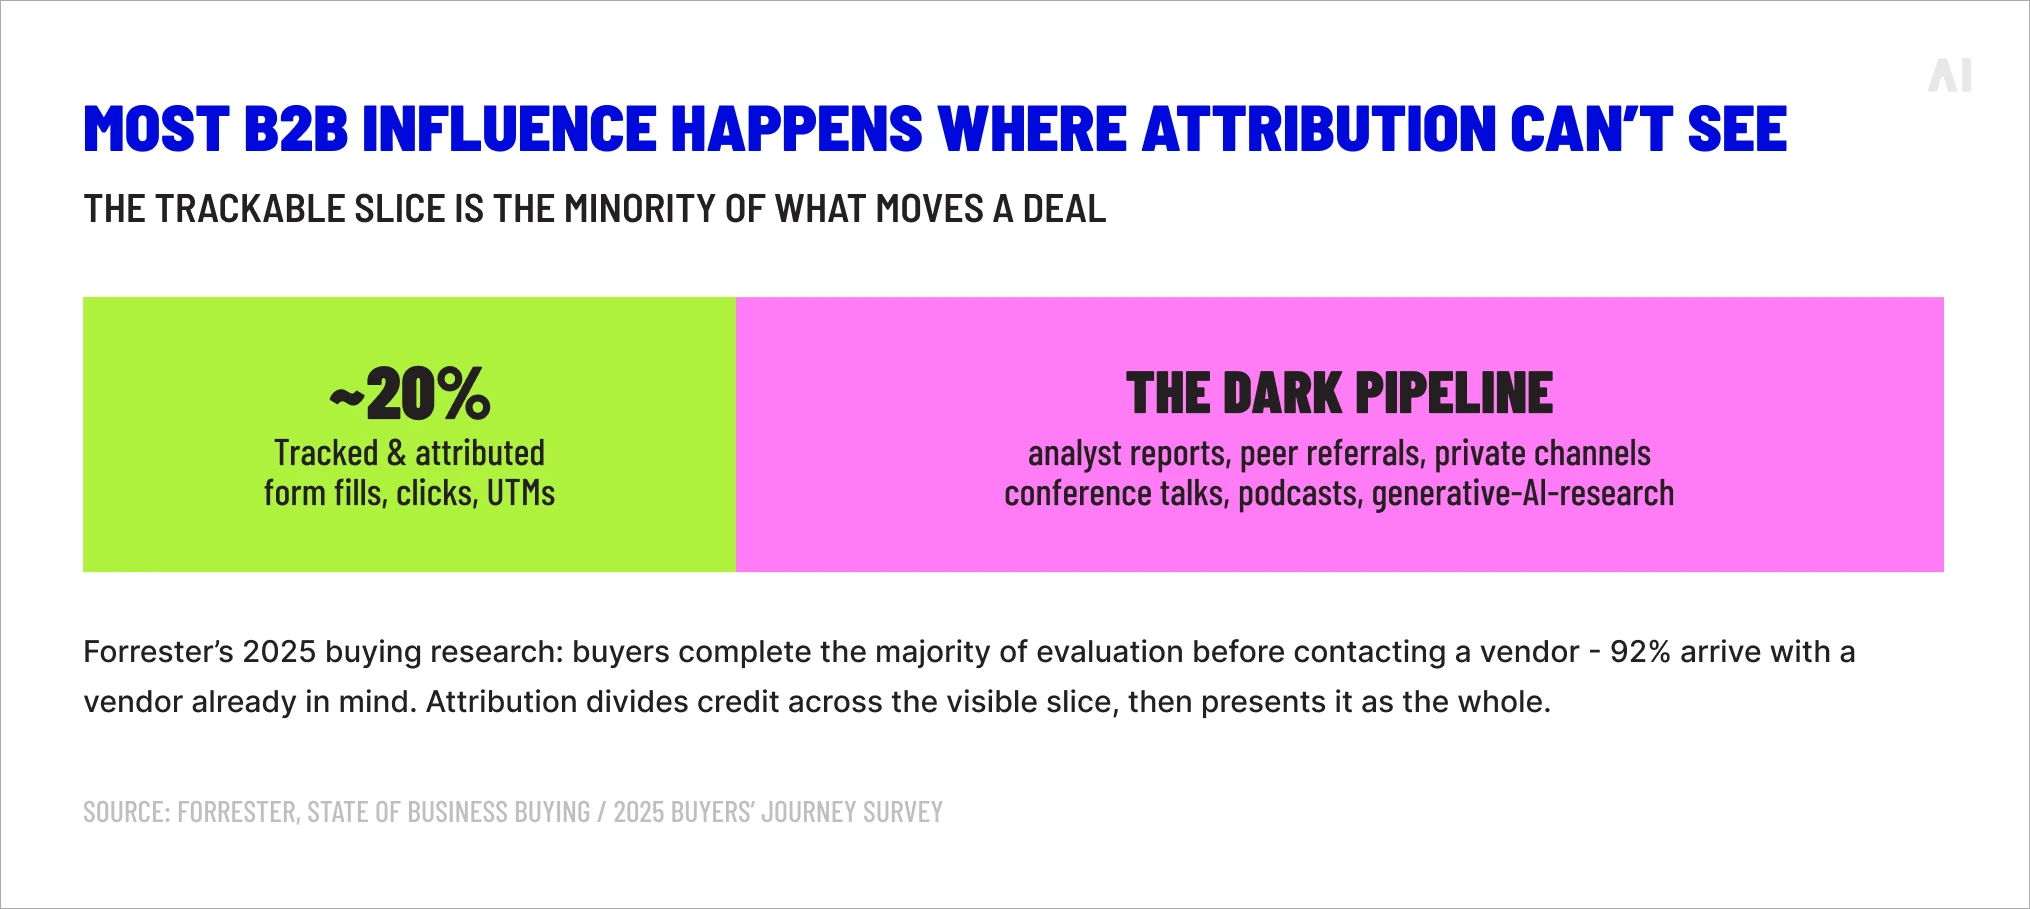
The second problem is that most B2B influence never produces a trackable event. Forrester's 2025 buying research finds that B2B buyers now complete the majority of their evaluation before they ever contact a vendor, and the same survey reports that 92% enter the process with at least one vendor already in mind and 41% with a single preferred vendor chosen before formal evaluation begins. By the time a buyer becomes a tracked lead, the decision is often most of the way made, shaped by inputs the attribution model cannot see.
Those inputs are the dark pipeline: analyst reports, peer recommendations, conversations at conferences, a competitor comparison forwarded inside a private channel, a podcast mention, increasingly a generative-AI research session. None of them leaves a UTM. Most surface in analytics as "direct traffic," if they surface at all. Gartner's finding that 61% of B2B buyers now prefer a rep-free buying experience compounds the gap, because a self-directed buyer generates even fewer of the handshake moments that traditional tracking depends on.
The practical consequence is that attribution does not divide credit across all the things that influenced a deal. It divides credit across the small, trackable subset, and then presents that division as if it were the full picture. A channel can be doing enormous work in the dark and show up in the dashboard as a rounding error.
The attribution gap tracked vs dark
Example of a modern B2B buying journey
Consider a mid-market manufacturer evaluating a new supply-chain platform, a purchase that runs eleven months from first interest to signed contract. In month one, the VP of operations hears the product mentioned on an industry podcast and, a week later, reads an explainer found through a search. Neither moment is tracked; the podcast leaves no link, and the article visit registers as anonymous. In month three, a procurement analyst downloads a comparison guide, finally generating a known first touch. Across months four to seven, three more stakeholders engage: the CFO reviews a pricing page after a colleague forwards the link in Teams, an IT architect attends a technical webinar, and the original VP returns via a retargeting ad. In month nine, legal joins to review terms, touching no marketing at all. The deal closes in month eleven after a sales-led proposal.
Run a last-touch model over this journey and the sales-led proposal, or the final retargeting click, takes all the credit.
Run first-touch and the procurement analyst's month-three download wins, even though the real origin was an untracked podcast eight weeks earlier.
A multi-touch model spreads credit across the three or four visible touches and still misses the podcast, the forwarded pricing link, and legal entirely.
Every model produces a confident answer. Every answer is wrong in a different direction, because the journey that generated the deal is mostly not in the data.
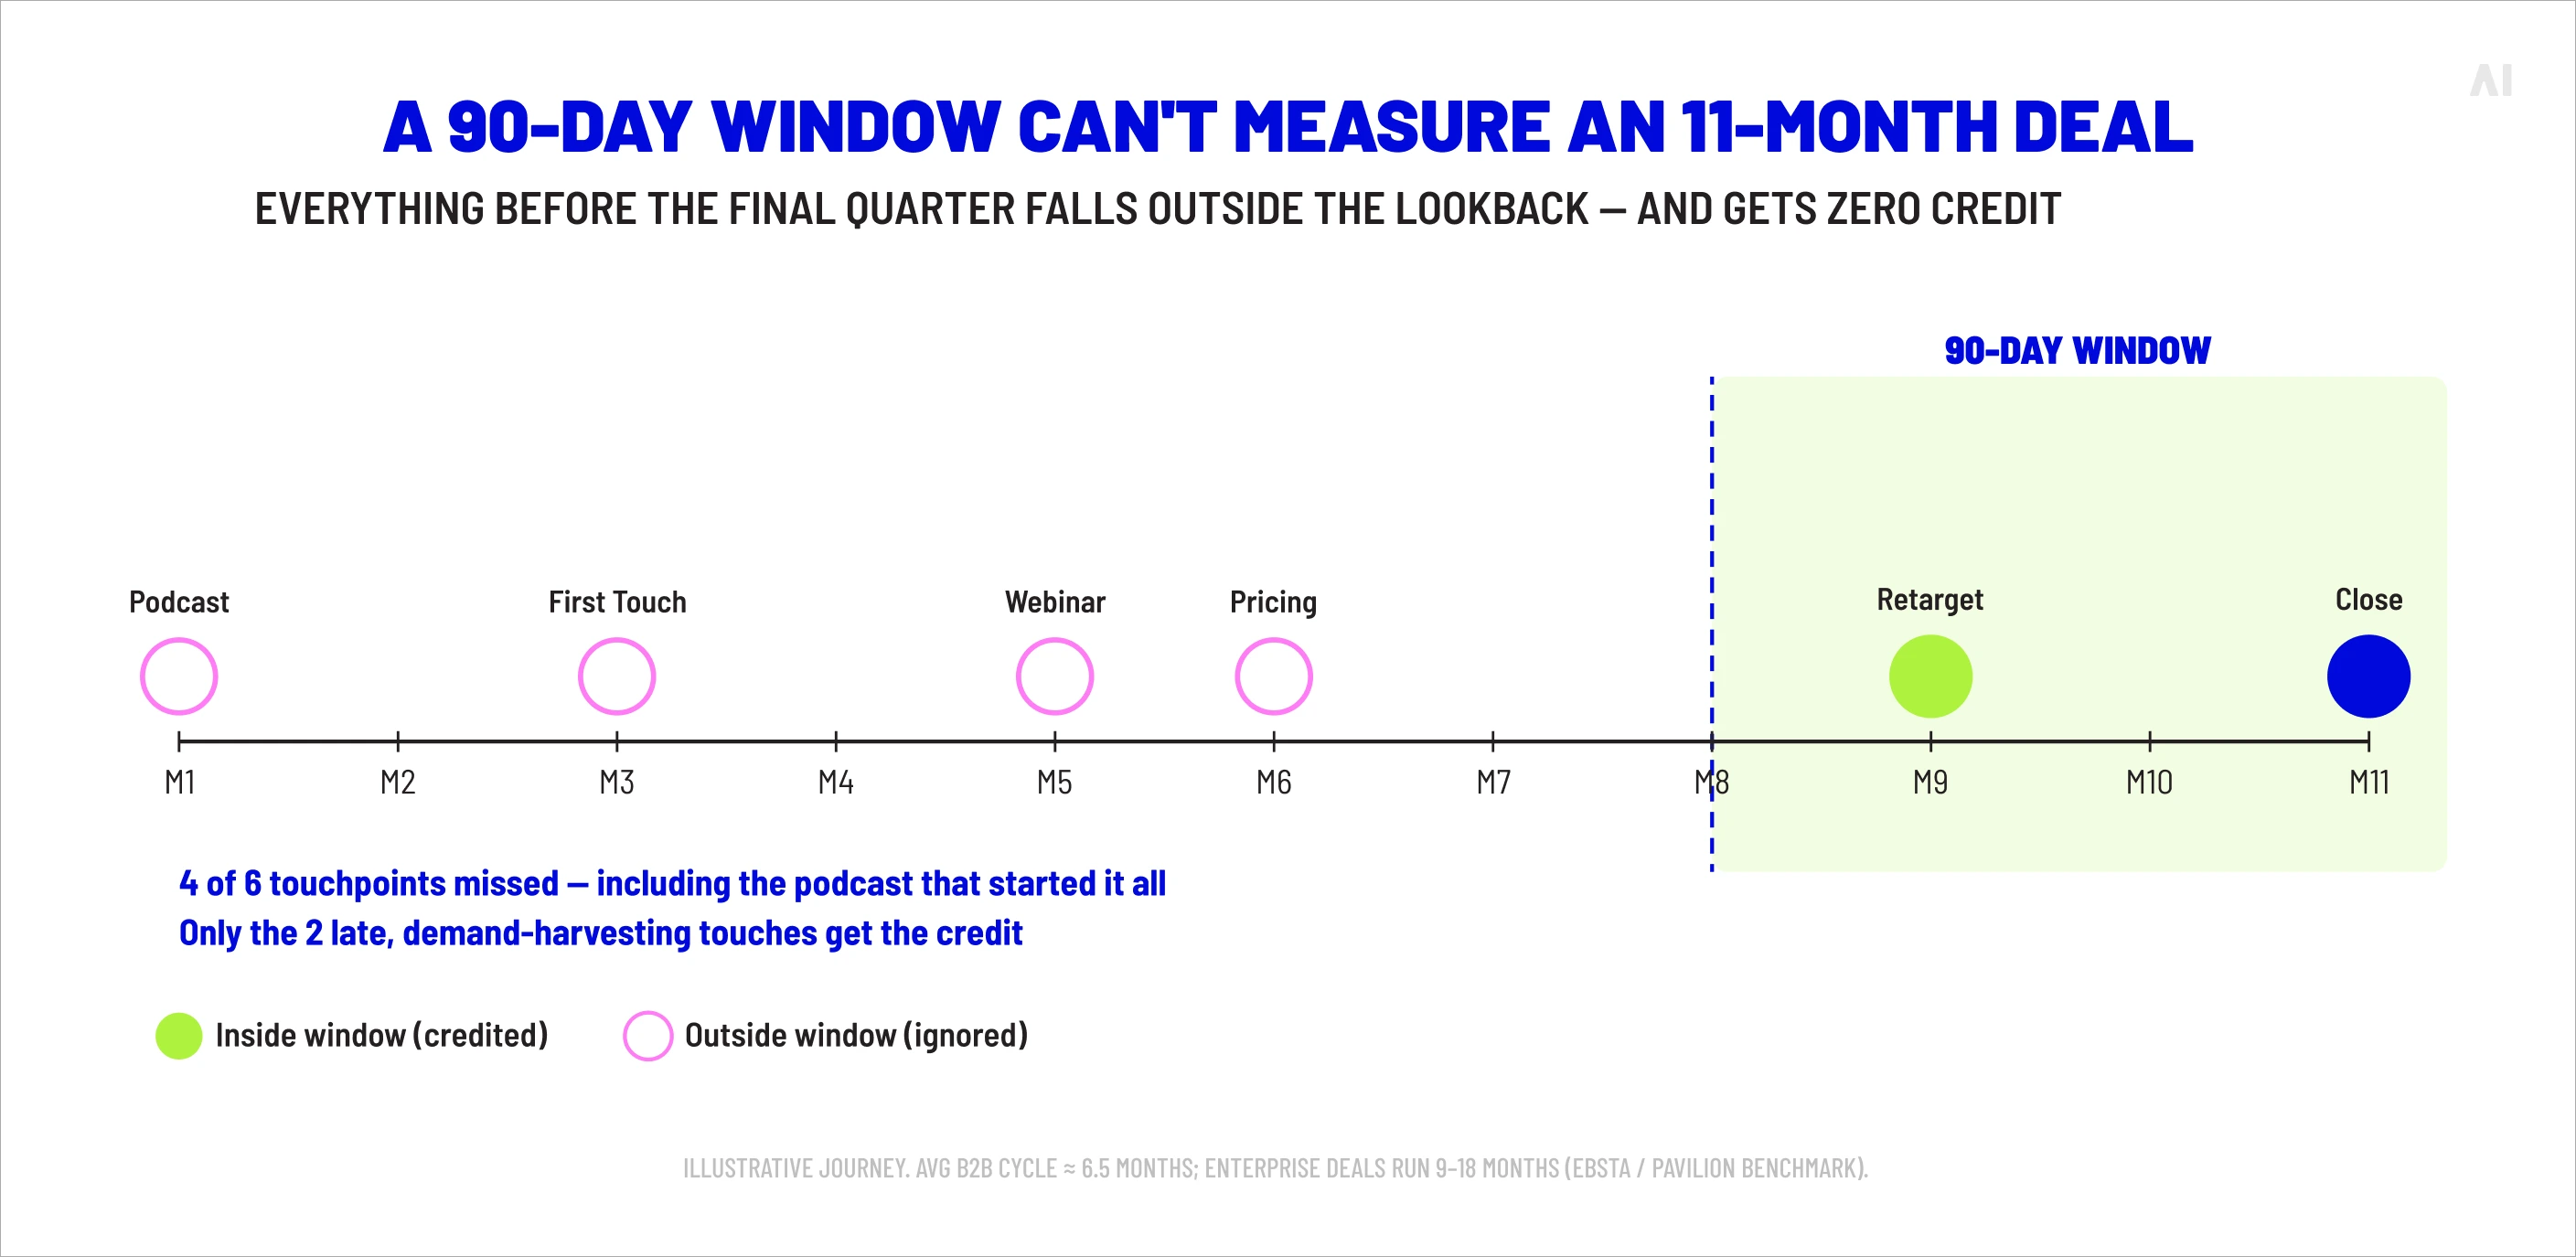
Even when the touchpoints exist, the clock usually erases them. Default attribution windows run 30 to 90 days, a sensible span for consumer purchases and a near-useless one for B2B. The Ebsta and Pavilion benchmark data puts the average B2B sales cycle at roughly 6.5 months, about 38% longer than in 2021, with enterprise deals over $100K routinely running nine to eighteen months.
The arithmetic is unforgiving. A 90-day window applied to an eleven-month deal sees only the final quarter of the journey. Every awareness and early-consideration touchpoint, exactly the part of the funnel that is hardest to influence and most valuable to understand, falls outside the lookback and receives zero credit. The model does not report that it missed them; it reports the late touches as if they were the whole story. Widen the same deal to a full-cycle window and the credit distribution can invert, with content and organic channels that looked worthless suddenly carrying the early influence they always had. The window is not a minor setting. In long cycles it decides the answer.
Attribution window vs cycle.
B2B attribution models: what they actually measure
There is no neutral attribution model. Each one encodes a specific assumption about where value is created, and that assumption decides which channels get funded. The useful way to compare B2B attribution models is not by mechanism but by the business question each can honestly answer, and the budget mistake each will produce if you ask it the wrong one. The four families below cover almost all B2B practice.
First-touch vs. last-touch attribution
Single-touch models assign 100% of the credit to one interaction, either the first or the last. Their appeal is honesty about their own simplicity: they are fast to implement, easy to explain, and impossible to misread. They also discard everything in between, which in a B2B cycle is almost everything that matters.
There are narrow scenarios where a single-touch signal is valid.
First-touch is a reasonable, if crude, proxy for which channels generate net-new awareness when you genuinely only want a top-of-funnel sourcing view.
Last-touch can answer the limited question of what tends to be present at the moment of conversion.
The tradeoff is the same in both directions: you buy clean, fast reporting at the price of systematically undercrediting every mid-cycle interaction. In a journey with a dozen touches across eleven months, awarding all the credit to one of them is less a measurement than a decision to ignore the other eleven.
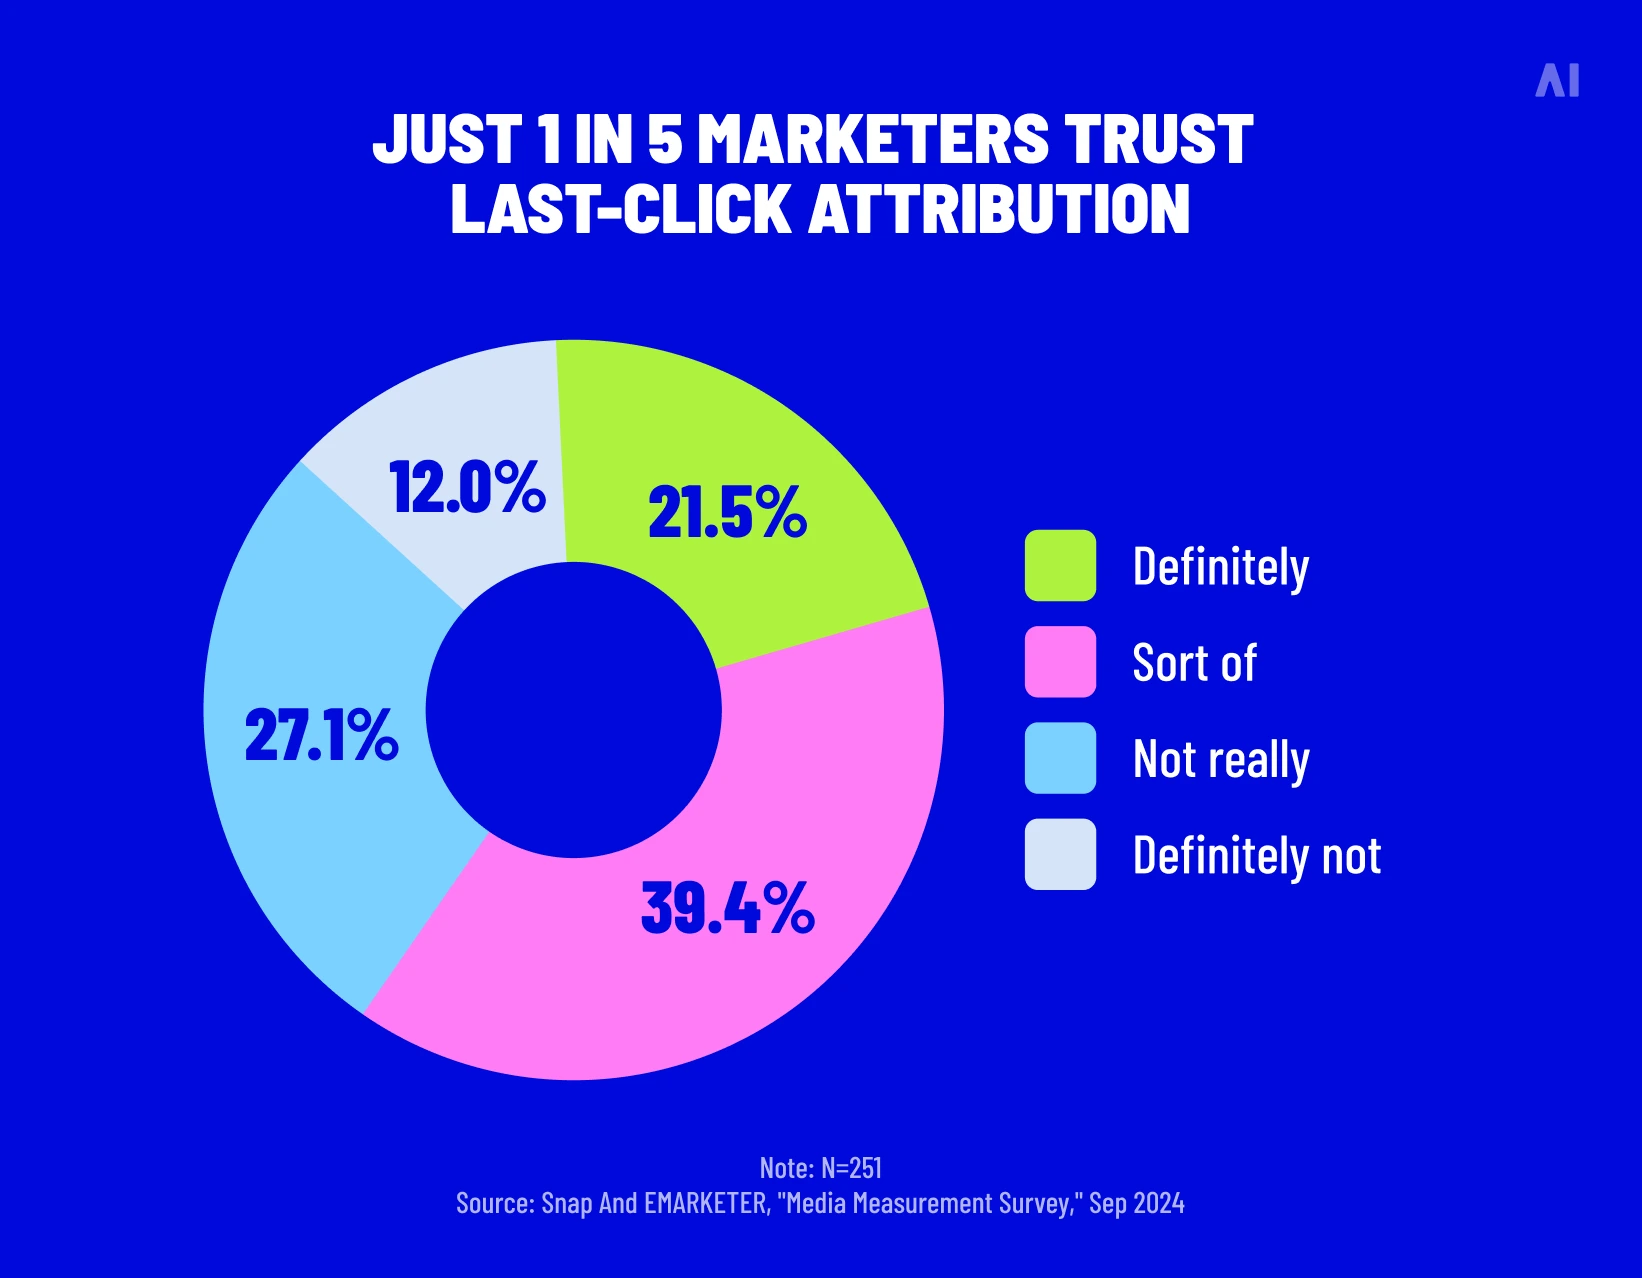
eMarketer: Just 1 in 5 marketers trust last-click attribution (Source)
U-shaped vs. W-shaped attribution
Position-based models keep the speed of single-touch reporting while acknowledging that more than one moment counts.
The U-shaped model splits the majority of credit between the first touch and the lead-conversion touch, with a smaller share spread across the middle.
The W-shaped model adds a third anchor, the opportunity-creation point, dividing the bulk of credit across three milestones that map cleanly onto a typical B2B funnel.
The choice between them follows your primary success metric. If the team is measured on MQL creation, U-shaped aligns with that reality by weighting the first and lead-generating touches. If the team is held to opportunity conversion, W-shaped is the better fit because it explicitly credits the moment a lead becomes a qualified opportunity.
Both models share a strength worth naming: they tie attribution credit to defined pipeline stages rather than to arbitrary positions, which makes them legible to sales and finance. Both also share a blind spot, in that they reward whichever touches happen to sit at the anchor points and underweight sustained nurture that occurs between them.
Time-decay attribution
Time-decay assigns more credit to touchpoints closer to the conversion, on the logic that recent interactions reflect active buying intent. For complex, technically evaluated sales, this often matches reality better than position-based models, because the late-stage demo, proof-of-concept, and technical deep-dive genuinely do carry disproportionate weight in the final decision.
The model lives or dies on one configuration choice: the decay rate, usually expressed as a half-life.
Set the half-life too short and time-decay degenerates into last-touch with extra steps, crushing all credit into the final weeks and erasing the early-cycle influence that long B2B journeys depend on.
Set it too long and the model flattens toward linear, losing the recency logic that justified choosing it.
The correct half-life is a function of your actual cycle length, which means it cannot be left at the platform default. A decay curve tuned for a three-week consumer purchase applied to a nine-month enterprise deal will report confident nonsense.
Data-driven attribution
Algorithmic, or data-driven, attribution uses machine learning to assign credit based on patterns in your own conversion data rather than a fixed rule. When it works, it is the most defensible approach available, because the weights come from observed behavior instead of an analyst's assumption. The condition attached to "when it works" is the catch.
Data-driven models need volume, depth, and clean history to produce stable output: a large number of conversions, rich touchpoint data on each, and a consistent tracking record long enough to learn from. Most mid-market B2B teams do not have this. With a few hundred closed deals a year spread across a dozen touchpoints each, the model has too few examples and too many variables, and it will happily fit noise, producing credit assignments that look sophisticated and swing unpredictably from quarter to quarter.
The uncomfortable pattern in the market is that this is precisely the model many mid-market teams are sold first, well before their data can support it. The mechanics of why low volume breaks these models is covered in the selection section below.
Attribution model comparison for B2B teams
Read across the table and a selection logic emerges that has little to do with model sophistication and everything to do with fit.
Single-touch models suit teams that need a fast directional read and can tolerate a known bias.
Position-based models suit teams with a defined funnel and a clear primary metric.
Time-decay suits long technical sales where recency is meaningful and someone is willing to tune the curve.
Data-driven suits high-volume operations with mature data and the discipline to leave it alone.
The most common and most expensive error is to skip this fit question and reach straight for the most advanced model, on the assumption that complexity equals accuracy. In B2B, a well-chosen simple model usually beats a poorly fed sophisticated one.
How to select the right B2B attribution model
Model selection in B2B comes down to three variables: how many deals you close, how long they take, and how good your data is. Get those three honest and the right model is usually obvious. The most important decision the framework produces is a negative one, knowing when your volume is too low for multi-touch attribution to mean anything at all.
B2B multi-touch attribution is, underneath the dashboard, astatistical method, and statistics need a sample. A team closing tens of deals a year, each shaped by a dozen idiosyncratic touchpoints, does not have the data density for any multi-touch model to produce stable credit. The weights will swing wildly on a single large deal, and the team will mistake variance for insight.
For low-volume, high-value B2B, the more reliable instruments are qualitative and account-level: pipeline-influence reporting that simply records which channels appeared anywhere in a won deal, structured win/loss interviews that ask buyers directly what shaped the decision, and self-reported attribution surveys at the point of conversion.
None of these is precise, but imprecise-and-honest beats precise-and-fabricated. A "how did you first hear about us" field, read alongside pipeline-influence data, will tell a ten-deals-a-quarter team more than a data-driven model ever could.
Account-level attribution
The single most consequential structural choice in B2B attribution is the unit of measurement itself: contacts or accounts.
Contact-level attribution credits individuals, which guarantees the buying-committee problem described earlier: a six-person committee becomes six disconnected records, and the model never sees that they belong to one deal.
Account-level attribution stitches every known contact at an organization to a single account and measures influence at that level.
For almost all B2B, account-level tracking is the correct foundation, not an enhancement. It is what lets you see that the CFO's pricing-page visit and the IT lead's webinar and the analyst's comparison download were all part of the same purchase. Without it, every model sitting on top inherits a fragmented view of reality, and no amount of modeling sophistication repairs a broken unit of analysis.
One model for the whole cycle
No single model serves every stage of a long cycle equally well, which is why mature teams apply different logic at different stages rather than forcing one model across all of them.
A first-touch or U-shaped lens makes sense for the awareness stage, where the question is what brought the account in.
A position-based or time-decay lens fits the nurture and consideration stages, where sustained engagement matters. A last-touch or sales-led view can answer narrow questions about the close.
The trap is double-counting. If three stage-specific models each claim credit for the same touchpoint, the totals inflate and the reporting becomes meaningless. The fix is in the CRM tagging structure: each touchpoint is assigned to a single lifecycle stage at the point of capture, so stage-specific models read from non-overlapping sets. Done well, this gives a stage-accurate view without crediting the same webinar three times.
For omnichannel journeys
Modern B2B buyers bounce between apps, browser tabs, physical events, email, review sites, and social platforms like caffeinated raccoons, often within a single afternoon and across several devices.
Rule-based models struggle with this because they assume a tidy sequence; the journeys are anything but tidy.
The volume caveat from earlier still applies: omnichannel sophistication only pays off when the data is deep enough to support it.
Attribution for forecasting and budget planning
Attribution earns its keep less as a backward-looking scorecard than as an input to forward planning. Once you can see which channels reliably appear early in won deals, you can forecast pipeline generation from current marketing activity, model budget scenarios against expected pipeline, and identify which channels scale efficiently and which plateau as you pour money in.
This is where measurement stops being an accounting exercise and starts being a planning one. A channel that sources cheap early-stage influence but saturates quickly should be funded differently from one that scales linearly, and only attribution data tied to pipeline outcomes makes that distinction visible before the money is spent.
Attribution alignment across marketing, sales, and RevOps
The most reliable model in the world fails if three teams define the funnel three different ways. When marketing counts an MQL on one logic, sales recognizes an opportunity on another, and RevOps reports revenue on a third, the attribution output reconciles to none of them and every meeting becomes an argument about whose number is right. Alignment is less a technical problem than a governance one: a shared set of lifecycle-stage definitions, a single agreed source of truth for revenue, and consistent reporting logic across all three functions. Without that shared vocabulary, attribution does not resolve cross-team disputes; it supplies fresh ammunition for them.
How to build a reliable B2B attribution system
A model is only as trustworthy as the data and governance beneath it. The difference between attribution that stays useful and attribution that drifts into fiction is almost always infrastructure, not algorithm. The work starts before any tool is chosen, with an audit of what you can actually measure.
Before selecting a platform, confirm four data foundations are in place, because no model can outrun broken inputs.
The first is UTM consistency: a single documented tagging convention applied everywhere, so the same campaign is not recorded under four spellings.
The second is CRM contact-to-account association, the stitching that makes account-level analysis possible.
The third is standardized lead-source fields, with a controlled vocabulary rather than free text, so "LinkedIn," "Linkedin," and "social" stop fragmenting the same channel.
The fourth is closed-loop opportunity data tied to revenue, so that influence can be traced all the way to money rather than stopping at the lead.
A team that fixes these four before buying software will get more from a basic model than a team that skips them gets from an expensive one. Attribution is, in the end, a budget-allocation project resting on data hygiene.
First-party data and attribution resilience
The observable signals that multi-touch attribution depends on have been eroding for years, between privacy regulation, mobile tracking restrictions, and the phased decline of third-party cookies. The durable response is to build on data you own. First-party customer data, CRM enrichment, and server-side tracking are becoming the load-bearing foundation of B2B measurement rather than a supplement to third-party signals. The move is uncomfortable because first-party data is harder to collect and never quite complete, but it has the one quality third-party signals are losing: it does not disappear when a browser changes its defaults.
Offline touchpoint tracking
A large share of B2B influence happens offline, at conferences, in sales conversations, on phone calls, and that influence is worth capturing without drowning the team in manual data entry. Three approaches help.
Calendar and call-logging integrations can record sales activity automatically into the CRM.
Event-capture tooling, from badge scans to dedicated event apps, can log conference interactions at the point they happen.
Conversation-intelligence platforms can transcribe and tag sales calls without a rep typing notes.
A realistic expectation matters here: even with good tooling, offline coverage will be partial. The goal is not to capture every hallway conversation, which is impossible, but to raise coverage enough that the offline channel stops looking artificially weak next to its fully tracked digital counterparts. Aiming for completeness guarantees disappointment; aiming for representative coverage is achievable.
Attribution window setup
The lookback window should be calculated from your own data, not adopted from a default. The method is straightforward: pull the distribution of deal cycle lengths from the CRM and set the window against the high end of it, typically using the p90, the length within which 90% of deals close, rather than the median. A window set to the p50 will, by definition, truncate roughly half your deals.
The stakes are concrete. As shown in the breakdown earlier, a window shorter than the cycle systematically transfers credit from early-stage channels to late-stage ones, because only the late touches fall inside the lookback. Lengthen the window to match the true cycle and credit redistributes toward the awareness and nurture channels that the short window had erased. Misconfigure this one setting and every downstream number is wrong in the same predictable direction.
Attribution validation
Before any output drives a budget decision, validate it three ways.
First, a historical backtest: run the model against past closed deals and check whether its credit assignments are consistent with what you already know happened.
Second, a qualitative comparison against sales intelligence, holding the model's story up against what the sales team and win/loss interviews say actually moved deals.
Third, an outlier-deal review, examining the deals where the model's verdict is most surprising, because surprises are either genuine insight or a sign the model is broken, and you need to know which.
Set a confidence threshold before, not after, you act. If the model cannot survive a backtest and broadly agree with sales reality, it is not yet ready to allocate money, however polished its dashboard looks.
Beyond marketing attribution: what actually caused revenue
Every attribution model, however well built, measures correlation. It records which touchpoints appeared before a conversion, not which ones caused it, and in B2B the gap between those two things is wide. Closing it requires methods built to estimate causation directly: incrementality testing and marketing mix modeling, which answer the question attribution structurally cannot, namely whether a channel actually drove revenue or merely showed up near it.
⚡ Attribution tells you which touchpoints were present when a deal closed. It cannot tell you which ones the deal would have closed without.
Attribution vs. incrementality
Incrementality testing asks a counterfactual question: what would have happened anyway? It compares a group exposed to a channel against a held-out control that was not, and reads the difference as the channel's true causal lift. This matters most for the channels attribution flatters hardest. Branded search and retargeting consistently top attribution reports, but they do so largely by intercepting buyers who were already in-market, people who would have converted regardless. Their high attribution numbers reflect self-selection, not creation. An incrementality test on branded search routinely reveals that a large share of its "attributed" conversions were never incremental at all, which is exactly why the channels that look best in a last-touch report are the ones most worth testing.
Marketing mix modeling takes the opposite vantage point from attribution. Instead of tracking individuals, it uses regression to decompose aggregate outcomes, sales or pipeline, into the contribution of each channel, including offline and brand channels that user-level tracking never sees. Because it needs no personal data, it has become the privacy-durable measurement method of the moment. According to a September 2025 eMarketer and TransUnion survey, 27.6% of US marketers now rate MMM their most reliable measurement methodology, ahead of multi-touch attribution at 19.4%, with 46.9% planning to invest in MMM over the following year.
MMM has real limits in B2B. It works best with high outcome volume and steady spend across channels, conditions that suit large consumer advertisers more than a B2B firm closing a few hundred deals a year, where the statistical signal can be too thin for stable decomposition. Historically it also demanded a dedicated data-science function, which put it out of reach for most mid-market teams.
That barrier is what platforms like AI Digital's Elevate, a marketing intelligence platform, are built to lower, bringing MMM-style budget simulation and saturation modeling into a workflow that does not require an in-house statistician. Used well, MMM answers the strategic budget question, where the next dollar works hardest, that attribution was never designed to answer.
Predictive attribution and AI modeling
AI-driven attribution extends the data-driven approach from explaining the past to anticipating the future. By analyzing historical pipeline patterns, deal velocity, and channel interaction sequences, these systems estimate not only what influenced past deals but which current opportunities are likely to progress and which channel mixes tend to accelerate them. The forward-looking element is the genuine advance: rather than a static post-mortem, the model becomes an input to forecasting and pacing. The same volume and data-quality conditions that govern any algorithmic model apply, and predictive output should be validated against real outcomes before it is trusted, but for teams with the data to support it, this is where attribution starts informing decisions while there is still time to act on them.
Path-to-conversion analysis asks a different and often more actionable question than attribution credit. Rather than apportioning value, it examines which sequences of touchpoints correlate with shorter cycles and larger deals. A team might learn that accounts which attend a technical webinar before a sales call close faster and at higher value than those that take the touches in the reverse order, an insight no credit-allocation model surfaces.
AI Digital's Elevate includes path-to-conversion analysis among its capabilities, visualizing the full sequence of interactions ahead of conversion rather than the final click alone. The output is less a verdict on which channel "won" than a map of which journeys tend to work, which is frequently the more useful thing for a revenue team to know.
Incrementality testing for B2B
The objection to incrementality testing in B2B is always low volume, and the answer is to test at a coarser unit than the individual. Quasi-experimental designs use industry verticals, sales territories, or account tiers as treatment and control groups: run a channel in one region and hold it out in a comparable one, then compare pipeline generation. The design is imperfect, because regions are never perfectly matched, but it produces a causal estimate where user-level testing is impossible.
The non-negotiable constraint is duration. A test must run at least one full sales cycle, and preferably longer, before its results mean anything; a six-week incrementality test on a nine-month cycle measures only noise. Patience is the price of causal answers in long-cycle B2B.
Attribution does not usually fail loudly. It fails by producing a confident, plausible, wrong number that a team acts on for several quarters before noticing the pipeline has thinned. The failure modes below each have a diagnostic signal, so the goal is to recognize the pattern before the budget follows it.
The most seductive mistake is trusting the channels that credit themselves. Branded search, retargeting, and direct traffic dominate attribution reports because they sit close to the conversion and catch buyers already in motion. They intercept demand rather than create it, yet the model reads interception as causation. The diagnostic signal is a mismatch between attribution credit and incrementality: a channel that looks dominant in last-touch reporting but shows little lift when tested is almost certainly harvesting demand created elsewhere. Path-to-conversion data exposes the same pattern, showing these channels appearing late in sequences whose early, demand-creating touches got no credit.
Walled garden reporting
When the platform selling the advertising also grades the advertising, the grades inflate. Each walled garden measures conversions inside its own environment using its own logic, and when several run at once they cheerfully claim the same conversion, so the summed reporting across channels can exceed 100% of the actual conversions. A team adding up platform-reported numbers ends up with a total that describes no reality. The diagnostic signal is simple: when your channel dashboards sum to more conversions than your CRM recorded, the platforms are double-counting. The structural fix is vendor-neutral measurement that sits outside the channels being measured, the principle behind AI Digital's Open Garden Framework, which keeps the measurement layer independent of the platforms competing for credit so that no channel grades its own work.
Attribution assumes the touchpoints it counts are real, and on the open programmatic market that assumption is unsafe. Invalid traffic, bot activity, and low-quality placements generate impressions and clicks that never came from a human buyer, and every one of those fake events enters the attribution model as a genuine touchpoint. The result is credit assigned to placements that influenced no one, distorting the entire model from the supply side. The diagnostic signal is a channel showing high touchpoint volume but negligible pipeline contribution.
Supply-side quality control is therefore a prerequisite for trustworthy reporting, not a separate concern: tools such as AI Digital's Smart Supply curate inventory and filter invalid traffic before it reaches a campaign, which keeps the touchpoints feeding attribution clean enough to believe.
The final mistake is treating the attribution model as the sole authority when it conflicts with what the sales team observed. Sales intelligence and attribution data frequently disagree: the model credits a channel sales never heard a buyer mention, or sales swears by a relationship the model cannot see. The wrong response is to declare one source correct and ignore the other. The model captures patterns across many deals that any individual rep will miss; the rep captures context from inside the deal that no model can record. Reconciling them, rather than picking a winner, is the discipline, and persistent conflicts between the two are usually a signal that something in the tracking, the definitions, or the dark pipeline needs investigating, not that one side is simply wrong.
How to choose a B2B attribution platform
Platform selection tends to get decided on feature checklists, which is the wrong basis for a long-cycle B2B team. The features that demo well are rarely the ones that determine whether the system tells the truth over a nine-month deal. Four structural requirements matter more than any feature list: account-level tracking, configurable attribution windows, genuine CRM synchronization, and independence from the channels being measured.
The first question is whether your CRM's built-in attribution is enough. Native HubSpot and Salesforce attribution handles the basics competently: it covers standard models, ties touchpoints to records you already maintain, and adds no integration overhead. It tends to break down on long, complex journeys, where the limits show up as rigid attribution windows, shallow multi-touch logic, and weak handling of offline and account-level influence.
The point at which a dedicated platform becomes necessary is usually when cycle length exceeds the native window options, when account-level stitching matters more than the CRM supports, or when the team needs incrementality and MMM capabilities the CRM does not offer. Below that threshold, native attribution is often the pragmatic choice, and buying a dedicated platform early adds cost without adding clarity.
A platform with fixed lookback windows cannot measure a business whose deals run nine to eighteen months. Configurable windows are essential, both because cycle length varies across segments and because the correct window is something you calculate from your own data rather than accept as a default. A team selling to both mid-market and enterprise needs different windows for each, and a platform that forces one global setting will misattribute one of them by construction.
Attribution within marketing intelligence platforms
Attribution is increasingly bought not as a standalone tool but as one capability inside a broader marketing intelligence platform that unifies CRM data, media performance, pipeline analytics, forecasting, and cross-channel reporting in a single environment. The logic is integration: an attribution number is more useful sitting beside the pipeline forecast and media data it should inform than isolated in a separate dashboard that someone has to reconcile by hand. Consolidating the measurement stack also reduces the definitional drift that occurs when each tool counts a lead its own way.
The most overlooked criterion is financial: an attribution system should not be owned by, or financially dependent on, the advertising channels it measures. When the measurement layer profits from the channels it grades, its incentives are not aligned with the advertiser's, and the inflation described in the walled-garden section becomes structural rather than accidental. Prioritizing a measurement system that is neutral toward every channel it reports on is the single best protection against paying for a scorecard that is rooting for one team.
Conclusion: make B2B attribution more actionable
No attribution model will ever capture B2B buying as it actually happens. The committees are too large, the journeys too long and too private, the offline influence too real to track completely. Any model that claims otherwise is selling false precision, and false precision is more dangerous than acknowledged uncertainty, because teams act on it with confidence.
The more useful goal is not a perfect ledger of credit but better decisions: budget allocated toward the channels that genuinely create pipeline rather than the ones that merely intercept it, clearer visibility into how deals actually progress, and a shared, defensible basis for the conversations between marketing, sales, and finance. That comes from matching the model to your volume and cycle, building the data foundation underneath it, validating before you act, and extending attribution with incrementality and MMM where correlation runs out. Treated that way, attribution stops being a reporting obligation and becomes a planning instrument.
AI Digital works with B2B teams on exactly this problem, as an end-to-end programmatic consultancy spanning vendor-neutral measurement through the Open Garden Framework, supply-side quality control through Smart Supply, and MMM, path-to-conversion, and budget simulation through the Elevate marketing intelligence platform. If your attribution is telling a story your pipeline does not support, get in touch and we can help you build measurement worth allocating against.
Blind spot
Key issues
Business impact
AI Digital solution
Lack of transparency in AI models
• Platforms own AI models and train on proprietary data • Brands have little visibility into decision-making • "Walled gardens" restrict data access
• Inefficient ad spend • Limited strategic control • Eroded consumer trust • Potential budget mismanagement
Open Garden framework providing: • Complete transparency • DSP-agnostic execution • Cross-platform data & insights
Optimizing ads vs. optimizing impact
• AI excels at short-term metrics but may struggle with brand building • Consumers can detect AI-generated content • Efficiency might come at cost of authenticity
• Short-term gains at expense of brand health • Potential loss of authentic connection • Reduced effectiveness in storytelling
Smart Supply offering: • Human oversight of AI recommendations • Custom KPI alignment beyond clicks • Brand-safe inventory verification
The illusion of personalization
• Segment optimization rebranded as personalization • First-party data infrastructure challenges • Personalization vs. surveillance concerns
• Potential mismatch between promise and reality • Privacy concerns affecting consumer trust • Cost barriers for smaller businesses
Elevate platform features: • Real-time AI + human intelligence • First-party data activation • Ethical personalization strategies
AI-Driven efficiency vs. decision-making
• AI shifting from tool to decision-maker • Black box optimization like Google Performance Max • Human oversight limitations
• Strategic control loss • Difficulty questioning AI outputs • Inability to measure granular impact • Potential brand damage from mistakes
Managed Service with: • Human strategists overseeing AI • Custom KPI optimization • Complete campaign transparency
Fig. 1. Summary of AI blind spots in advertising
Dimension
Walled garden advantage
Walled garden limitation
Strategic impact
Audience access
Massive, engaged user bases
Limited visibility beyond platform
Reach without understanding
Data control
Sophisticated targeting tools
Data remains siloed within platform
Fragmented customer view
Measurement
Detailed in-platform metrics
Inconsistent cross-platform standards
Difficult performance comparison
Intelligence
Platform-specific insights
Limited data portability
Restricted strategic learning
Optimization
Powerful automated tools
Black-box algorithms
Reduced marketer control
Fig. 2. Strategic trade-offs in walled garden advertising.
Core issue
Platform priority
Walled garden limitation
Real-world example
Attribution opacity
Claiming maximum credit for conversions
Limited visibility into true conversion paths
Meta and TikTok's conflicting attribution models after iOS privacy updates
Data restrictions
Maintaining proprietary data control
Inability to combine platform data with other sources
Amazon DSP's limitations on detailed performance data exports
Cross-channel blindspots
Keeping advertisers within ecosystem
Fragmented view of customer journey
YouTube/DV360 campaigns lacking integration with non-Google platforms
Black box algorithms
Optimizing for platform revenue
Reduced control over campaign execution
Self-serve platforms using opaque ML models with little advertiser input
Performance reporting
Presenting platform in best light
Discrepancies between platform-reported and independently measured results
Consistently higher performance metrics in platform reports vs. third-party measurement
Fig. 1. The Walled garden misalignment: Platform interests vs. advertiser needs.
Key dimension
Challenge
Strategic imperative
ROAS volatility
Softer returns across digital channels
Shift from soft KPIs to measurable revenue impact
Media planning
Static plans no longer effective
Develop agile, modular approaches adaptable to changing conditions
Brand/performance
Traditional division dissolving
Create full-funnel strategies balancing long-term equity with short-term conversion
Capability
Key features
Benefits
Performance data
Elevate forecasting tool
• Vertical-specific insights • Historical data from past economic turbulence • "Cascade planning" functionality • Real-time adaptation
• Provides agility to adjust campaign strategy based on performance • Shows which media channels work best to drive efficient and effective performance • Confident budget reallocation • Reduces reaction time to market shifts
• Dataset from 10,000+ campaigns • Cuts response time from weeks to minutes
• Reaches people most likely to buy • Avoids wasted impressions and budgets on poor-performing placements • Context-aligned messaging
• 25+ billion bid requests analyzed daily • 18% improvement in working media efficiency • 26% increase in engagement during recessions
Full-funnel accountability
• Links awareness campaigns to lower funnel outcomes • Tests if ads actually drive new business • Measures brand perception changes • "Ask Elevate" AI Chat Assistant
• Upper-funnel to outcome connection • Sentiment shift tracking • Personalized messaging • Helps balance immediate sales vs. long-term brand building
• Natural language data queries • True business impact measurement
Open Garden approach
• Cross-platform and channel planning • Not locked into specific platforms • Unified cross-platform reach • Shows exactly where money is spent
• Reduces complexity across channels • Performance-based ad placement • Rapid budget reallocation • Eliminates platform-specific commitments and provides platform-based optimization and agility
• Coverage across all inventory sources • Provides full visibility into spending • Avoids the inability to pivot across platform as you’re not in a singular platform
Fig. 1. How AI Digital helps during economic uncertainty.
Trend
What it means for marketers
Supply & demand lines are blurring
Platforms from Google (P-Max) to Microsoft are merging optimization and inventory in one opaque box. Expect more bundled “best available” media where the algorithm, not the trader, decides channel and publisher mix.
Walled gardens get taller
Microsoft’s O&O set now spans Bing, Xbox, Outlook, Edge and LinkedIn, which just launched revenue-sharing video programs to lure creators and ad dollars. (Business Insider)
Retail & commerce media shape strategy
Microsoft’s Curate lets retailers and data owners package first-party segments, an echo of Amazon’s and Walmart’s approaches. Agencies must master seller-defined audiences as well as buyer-side tactics.
AI oversight becomes critical
Closed AI bidding means fewer levers for traders. Independent verification, incrementality testing and commercial guardrails rise in importance.
Fig. 1. Platform trends and their implications.
Metric
Connected TV (CTV)
Linear TV
Video Completion Rate
94.5%
70%
Purchase Rate After Ad
23%
12%
Ad Attention Rate
57% (prefer CTV ads)
54.5%
Viewer Reach (U.S.)
85% of households
228 million viewers
Retail Media Trends 2025
Access Complete consumer behaviour analyses and competitor benchmarks.
Identify and categorize audience groups based on behaviors, preferences, and characteristics
Michaels Stores: Implemented a genAI platform that increased email personalization from 20% to 95%, leading to a 41% boost in SMS click through rates and a 25% increase in engagement.
Estée Lauder: Partnered with Google Cloud to leverage genAI technologies for real-time consumer feedback monitoring and analyzing consumer sentiment across various channels.
High
Medium
Automated ad campaigns
Automate ad creation, placement, and optimization across various platforms
Showmax: Partnered with AI firms toautomate ad creation and testing, reducing production time by 70% while streamlining their quality assurance process.
Headway: Employed AI tools for ad creation and optimization, boosting performance by 40% and reaching 3.3 billion impressions while incorporating AI-generated content in 20% of their paid campaigns.
High
High
Brand sentiment tracking
Monitor and analyze public opinion about a brand across multiple channels in real time
L’Oréal: Analyzed millions of online comments, images, and videos to identify potential product innovation opportunities, effectively tracking brand sentiment and consumer trends.
Kellogg Company: Used AI to scan trending recipes featuring cereal, leveraging this data to launch targeted social campaigns that capitalize on positive brand sentiment and culinary trends.
High
Low
Campaign strategy optimization
Analyze data to predict optimal campaign approaches, channels, and timing
DoorDash: Leveraged Google’s AI-powered Demand Gen tool, which boosted its conversion rate by 15 times and improved cost per action efficiency by 50% compared with previous campaigns.
Kitsch: Employed Meta’s Advantage+ shopping campaigns with AI-powered tools to optimize campaigns, identifying and delivering top-performing ads to high-value consumers.
High
High
Content strategy
Generate content ideas, predict performance, and optimize distribution strategies
JPMorgan Chase: Collaborated with Persado to develop LLMs for marketing copy, achieving up to 450% higher clickthrough rates compared with human-written ads in pilot tests.
Hotel Chocolat: Employed genAI for concept development and production of its Velvetiser TV ad, which earned the highest-ever System1 score for adomestic appliance commercial.
High
High
Personalization strategy development
Create tailored messaging and experiences for consumers at scale
Stitch Fix: Uses genAI to help stylists interpret customer feedback and provide product recommendations, effectively personalizing shopping experiences.
Instacart: Uses genAI to offer customers personalized recipes, mealplanning ideas, and shopping lists based on individual preferences and habits.
Medium
Medium
Share article
Url copied to clipboard
No items found.
Subscribe to our Newsletter
THANK YOU FOR YOUR SUBSCRIPTION
Oops! Something went wrong while submitting the form.
Questions? We have answers
What is the best attribution model for B2B marketing?
There is no single best model; the right one depends on your deal volume, sales-cycle length, and data maturity. For most B2B teams with defined funnels and medium-to-long cycles, position-based (W-shaped) or time-decay models tuned to the actual cycle length offer the best balance of accuracy and usability. High-volume teams with mature data can move to data-driven attribution, while low-volume teams are better served by pipeline-influence reporting and self-reported attribution than by any multi-touch model.
Why does last-click attribution fail in long sales cycles?
Last-click awards all credit to the final touchpoint before conversion, which in a six-to-eighteen-month B2B cycle means crediting the close while ignoring every awareness and nurture interaction that created the opportunity months earlier. It systematically over-rewards late, demand-harvesting channels and defunds the early-stage work that actually fills the pipeline.
Which attribution model works best for account-based marketing (ABM)?
ABM requires account-level attribution rather than any specific credit-allocation rule, because the unit of measurement must be the account, not the individual contact. On that foundation, W-shaped or stage-specific models work well, since they map credit to pipeline milestones across the whole buying committee rather than to a single tracked person.
What is the difference between attribution and incrementality?
Attribution measures correlation, recording which touchpoints appeared before a conversion. Incrementality measures causation, comparing an exposed group against a held-out control to estimate what a channel actually added beyond what would have happened anyway. Attribution tells you what was present; incrementality tells you what made a difference, which is why high-attribution channels like branded search often show low incremental lift.
How long should a B2B attribution window be?
Calculate it from your own CRM data rather than using a default. Set the window against the high end of your deal-cycle distribution, typically the p90 length within which 90% of deals close, so that early-stage touchpoints are not truncated. For enterprise cycles of nine to eighteen months, that means windows far longer than the standard 30-to-90-day defaults.
Can attribution models track offline sales interactions?
Partially. Calendar and call-logging integrations, event-capture tools, and conversation-intelligence platforms can record much offline activity automatically, but coverage will always be incomplete. The realistic goal is representative coverage that keeps offline channels from looking artificially weak next to fully tracked digital ones, not the capture of every conversation.
How do AI-driven attribution models work in B2B marketing?
They use machine learning to assign credit based on patterns in your own conversion data, and predictive versions extend this to forecast which current opportunities are likely to progress and which channel sequences tend to accelerate them. They require high conversion volume and clean data to produce stable results, and their output should be validated against real outcomes before driving budget decisions.
Have other questions?
If you have more questions, contact us so we can help.
Questions? We have answers
This is some text inside of a div block.
Lorem ipsum dolor sit amet, consectetur adipiscing elit. Suspendisse varius enim in eros elementum tristique. Duis cursus, mi quis viverra ornare, eros dolor interdum nulla, ut commodo diam libero vitae erat. Aenean faucibus nibh et justo cursus id rutrum lorem imperdiet. Nunc ut sem vitae risus tristique posuere.
This is some text inside of a div block.
Lorem ipsum dolor sit amet, consectetur adipiscing elit. Suspendisse varius enim in eros elementum tristique. Duis cursus, mi quis viverra ornare, eros dolor interdum nulla, ut commodo diam libero vitae erat. Aenean faucibus nibh et justo cursus id rutrum lorem imperdiet. Nunc ut sem vitae risus tristique posuere.
This is some text inside of a div block.
Lorem ipsum dolor sit amet, consectetur adipiscing elit. Suspendisse varius enim in eros elementum tristique. Duis cursus, mi quis viverra ornare, eros dolor interdum nulla, ut commodo diam libero vitae erat. Aenean faucibus nibh et justo cursus id rutrum lorem imperdiet. Nunc ut sem vitae risus tristique posuere.
This is some text inside of a div block.
Lorem ipsum dolor sit amet, consectetur adipiscing elit. Suspendisse varius enim in eros elementum tristique. Duis cursus, mi quis viverra ornare, eros dolor interdum nulla, ut commodo diam libero vitae erat. Aenean faucibus nibh et justo cursus id rutrum lorem imperdiet. Nunc ut sem vitae risus tristique posuere.
This is some text inside of a div block.
Lorem ipsum dolor sit amet, consectetur adipiscing elit. Suspendisse varius enim in eros elementum tristique. Duis cursus, mi quis viverra ornare, eros dolor interdum nulla, ut commodo diam libero vitae erat. Aenean faucibus nibh et justo cursus id rutrum lorem imperdiet. Nunc ut sem vitae risus tristique posuere.
This is some text inside of a div block.
Lorem ipsum dolor sit amet, consectetur adipiscing elit. Suspendisse varius enim in eros elementum tristique. Duis cursus, mi quis viverra ornare, eros dolor interdum nulla, ut commodo diam libero vitae erat. Aenean faucibus nibh et justo cursus id rutrum lorem imperdiet. Nunc ut sem vitae risus tristique posuere.
This is some text inside of a div block.
Lorem ipsum dolor sit amet, consectetur adipiscing elit. Suspendisse varius enim in eros elementum tristique. Duis cursus, mi quis viverra ornare, eros dolor interdum nulla, ut commodo diam libero vitae erat. Aenean faucibus nibh et justo cursus id rutrum lorem imperdiet. Nunc ut sem vitae risus tristique posuere.

.svg)
.svg)