Why Fragmented Data Is Breaking Cross-Platform Performance
Tatev Malkhasyan
April 30, 2026
11
minutes read
Every platform in your media mix is telling you a different story about the same campaign, and none of them have the full picture. In this article, we explore why fragmented data is actively breaking cross-platform performance and why unified measurement is no longer optional for marketers managing budgets across channels.
Advertisers have never had more data at their disposal, more platforms to activate against, or more measurement signals to evaluate. And yet, data fragmentation in advertising remains one of the most persistent barriers to performance. The volume of data has grown exponentially, but the infrastructure to unify, align, and interpret that data across platforms has not kept pace. Each channel operates its own reporting logic, defines its own metrics, and attributes conversions according to its own models. The result is a landscape where every platform tells a different story about the same campaign — and none of those stories are complete.
This article examines why fragmented marketing data is not just an inconvenience but a structural problem that actively undermines cross-platform decision-making, inflates costs, and prevents marketers from understanding what actually drives results. It also outlines what a unified approach to data and measurement makes possible.
Most marketing organizations describe themselves as data-driven. Dashboards are checked daily. Reports are circulated weekly. Performance reviews happen monthly. On the surface, everything looks rigorous.
The problem is that nearly all of those decisions happen inside platform silos. A media buyer optimizes Meta campaigns using Meta's reporting. A search marketer evaluates Google Ads performance using Google's attribution. A CTV buyer reviews completion rates inside the DSP's interface. Each decision appears informed, but each one is also confined to a single environment with no ability to compare results on equal terms.
This creates a false sense of visibility. Marketers see data — plenty of it — but they are looking at fragments rather than a whole picture. The metrics are real; the conclusions drawn from them are often misleading because they lack the cross-platform context needed to evaluate true performance.
Platform dashboards are designed to present the platform in the most favourable light. That is not a conspiracy; it is a product design choice. When every platform optimizes its own reporting to demonstrate value, the advertiser receives multiple competing narratives, each internally consistent but externally contradictory. Spending more time inside those dashboards does not solve the problem. It reinforces it.
Fragmentation is often discussed in abstract terms. In practice, it shows up in specific, recognisable patterns that marketing teams navigate every day.
Disconnected reporting environments
A typical multi-channel campaign might involve Google Ads, Meta, a programmatic DSP, a CTV platform, and a social channel like TikTok or LinkedIn. Each of these environments generates its own reports, uses its own dashboard, and presents performance in its own format. None of them communicate with each other natively.
The marketer is left to manually export, normalize, and compare data across environments—a process that is time-consuming, error-prone, and fundamentally limited by the fact that each platform's data was never designed to be combined with another's. According to Forrester, disconnected data sources, inconsistent quality, and limited internal resources are among the most common barriers preventing marketers from making effective use of measurement and analytics.
Inconsistent metrics and definitions
The word "conversion" travels across platforms but changes meaning at every stop. Meta may credit a view-through conversion within a one-day window. Google may demand a direct click inside seven days. A DSP may count any post-impression site visit over 30 days. Far from minor technicalities, these differences alter the shape of performance data at a foundational level.
The same inconsistency applies to reach, engagement, impressions, and viewability. When each platform defines these terms differently, any attempt at cross-channel comparison is built on mismatched foundations. Budgets shift based on metrics that are not measuring the same thing.
Misaligned attribution models
Attribution is where fragmentation becomes most damaging. Each platform applies its own attribution logic—last-click, view-through, fractional, or proprietary algorithmic models—and each one assigns credit in a way that favours its own channel.
The result is that three platforms can claim credit for the same conversion. The marketer's ad platforms might collectively report 120 conversions, while the payment processor records 45 actual transactions. This is not a data error; it is a structural consequence of each platform measuring independently without any shared framework for deduplication.
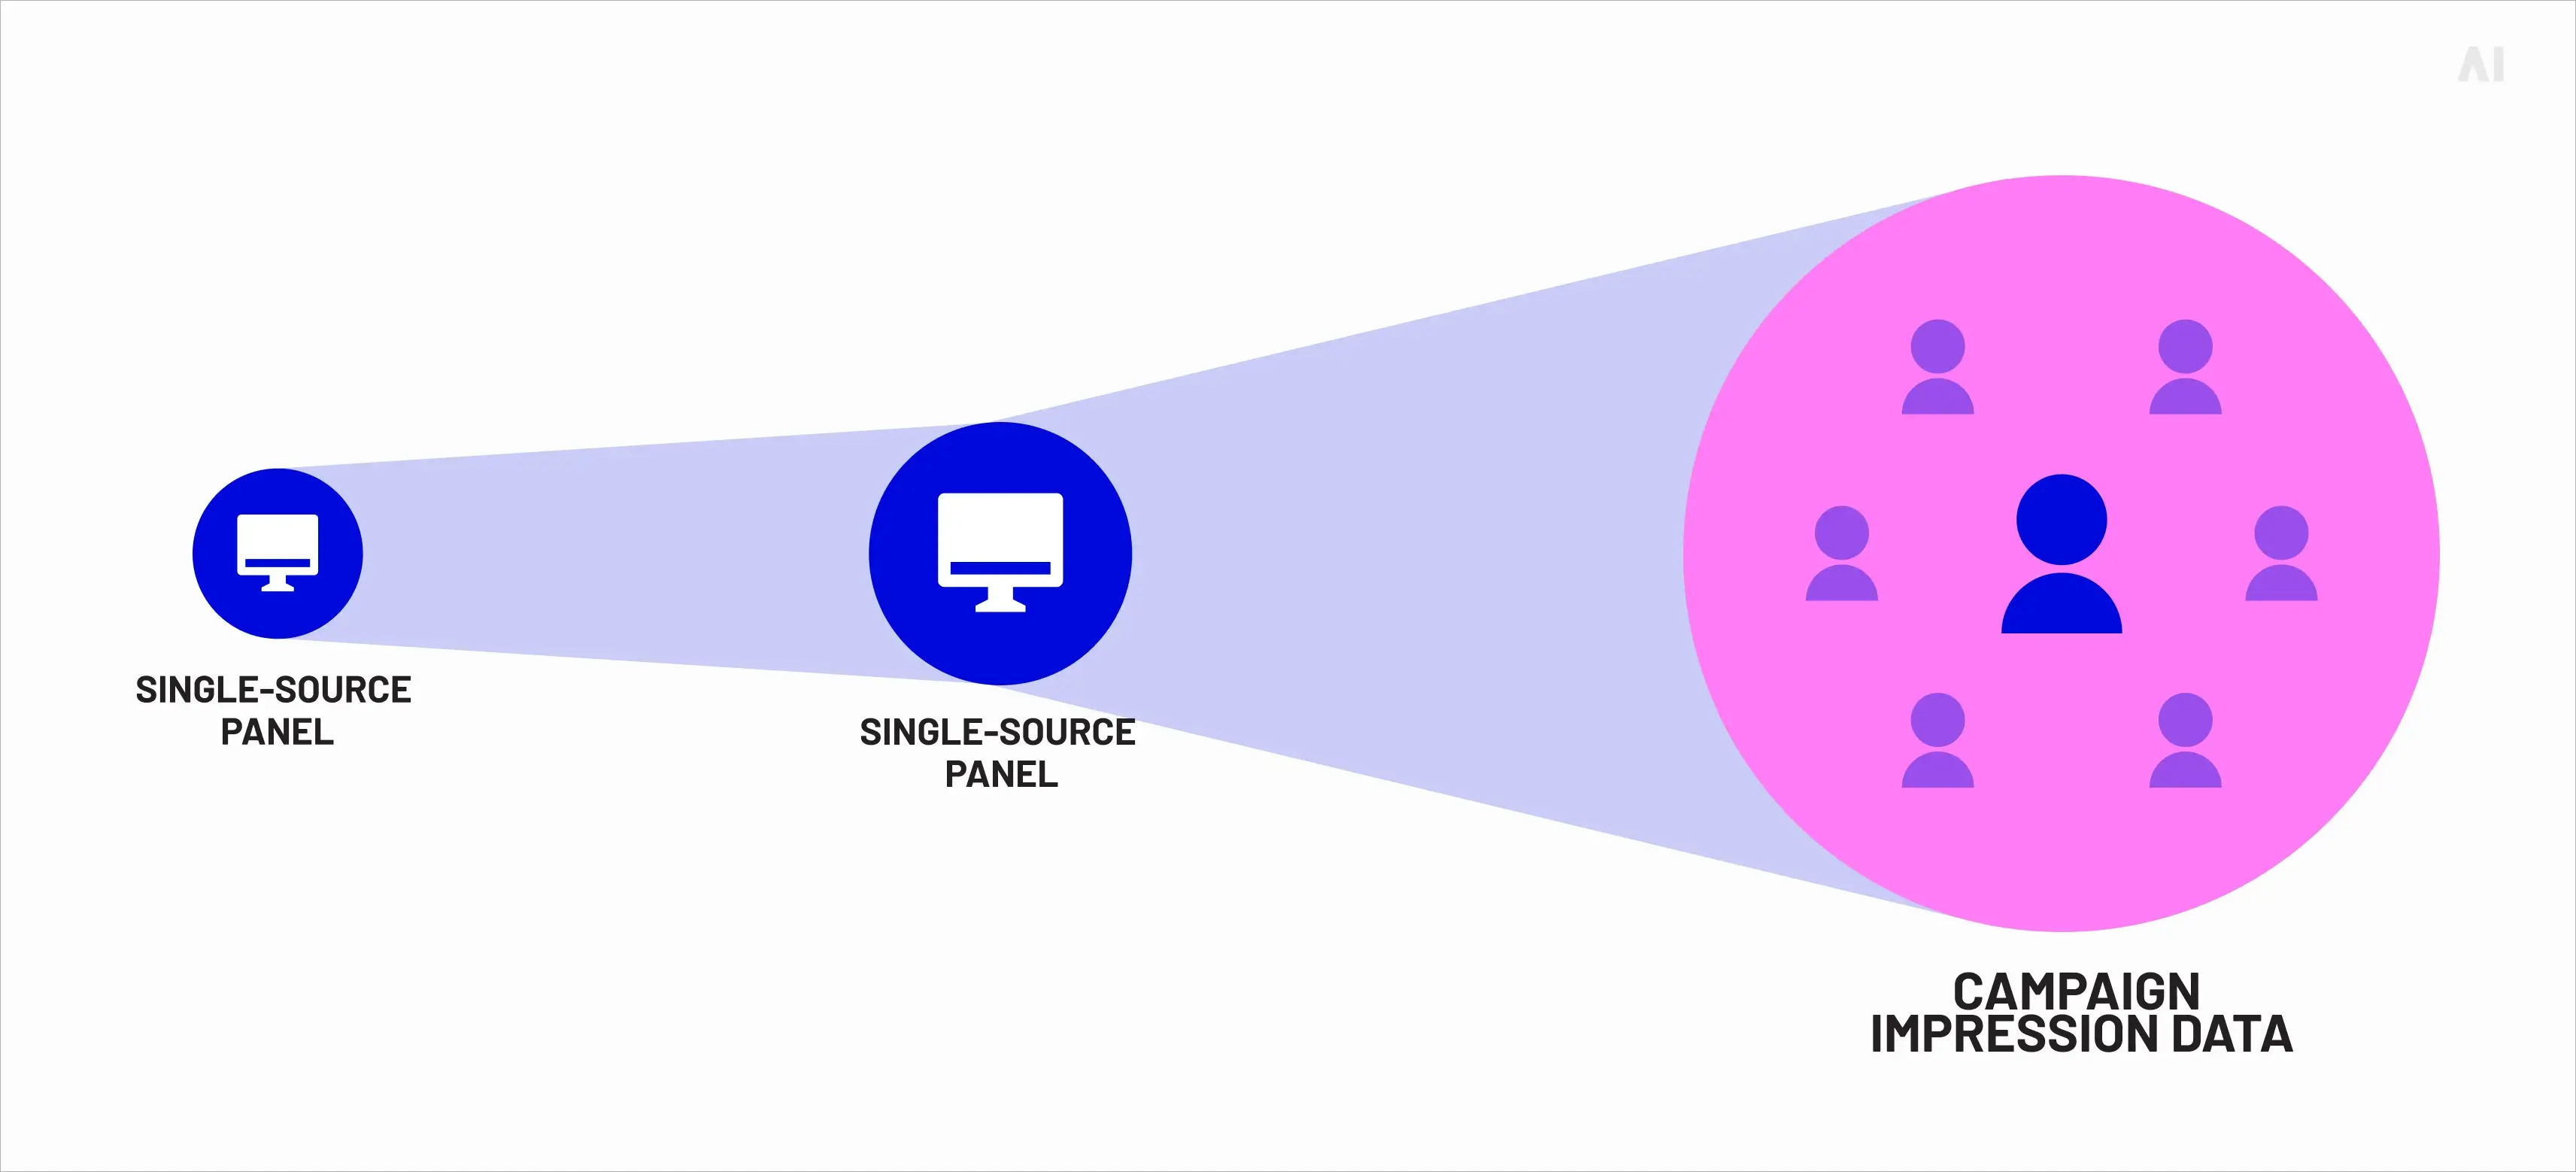
No shared user identity
Without cross-platform identity resolution, platforms cannot recognise the same person across channels. A user who sees a display ad on mobile, researches the product on desktop, and converts via a tablet app appears as three separate individuals in three separate reports.
This breaks frequency management, audience suppression, and sequential messaging. It also means that every audience insight generated by a single platform is, by definition, incomplete. The user is fragmented just as the data is.
Why platforms cannot provide a unified view
It would be convenient if platforms simply agreed to share data and align their measurement. They will not, and the reasons are structural rather than incidental.
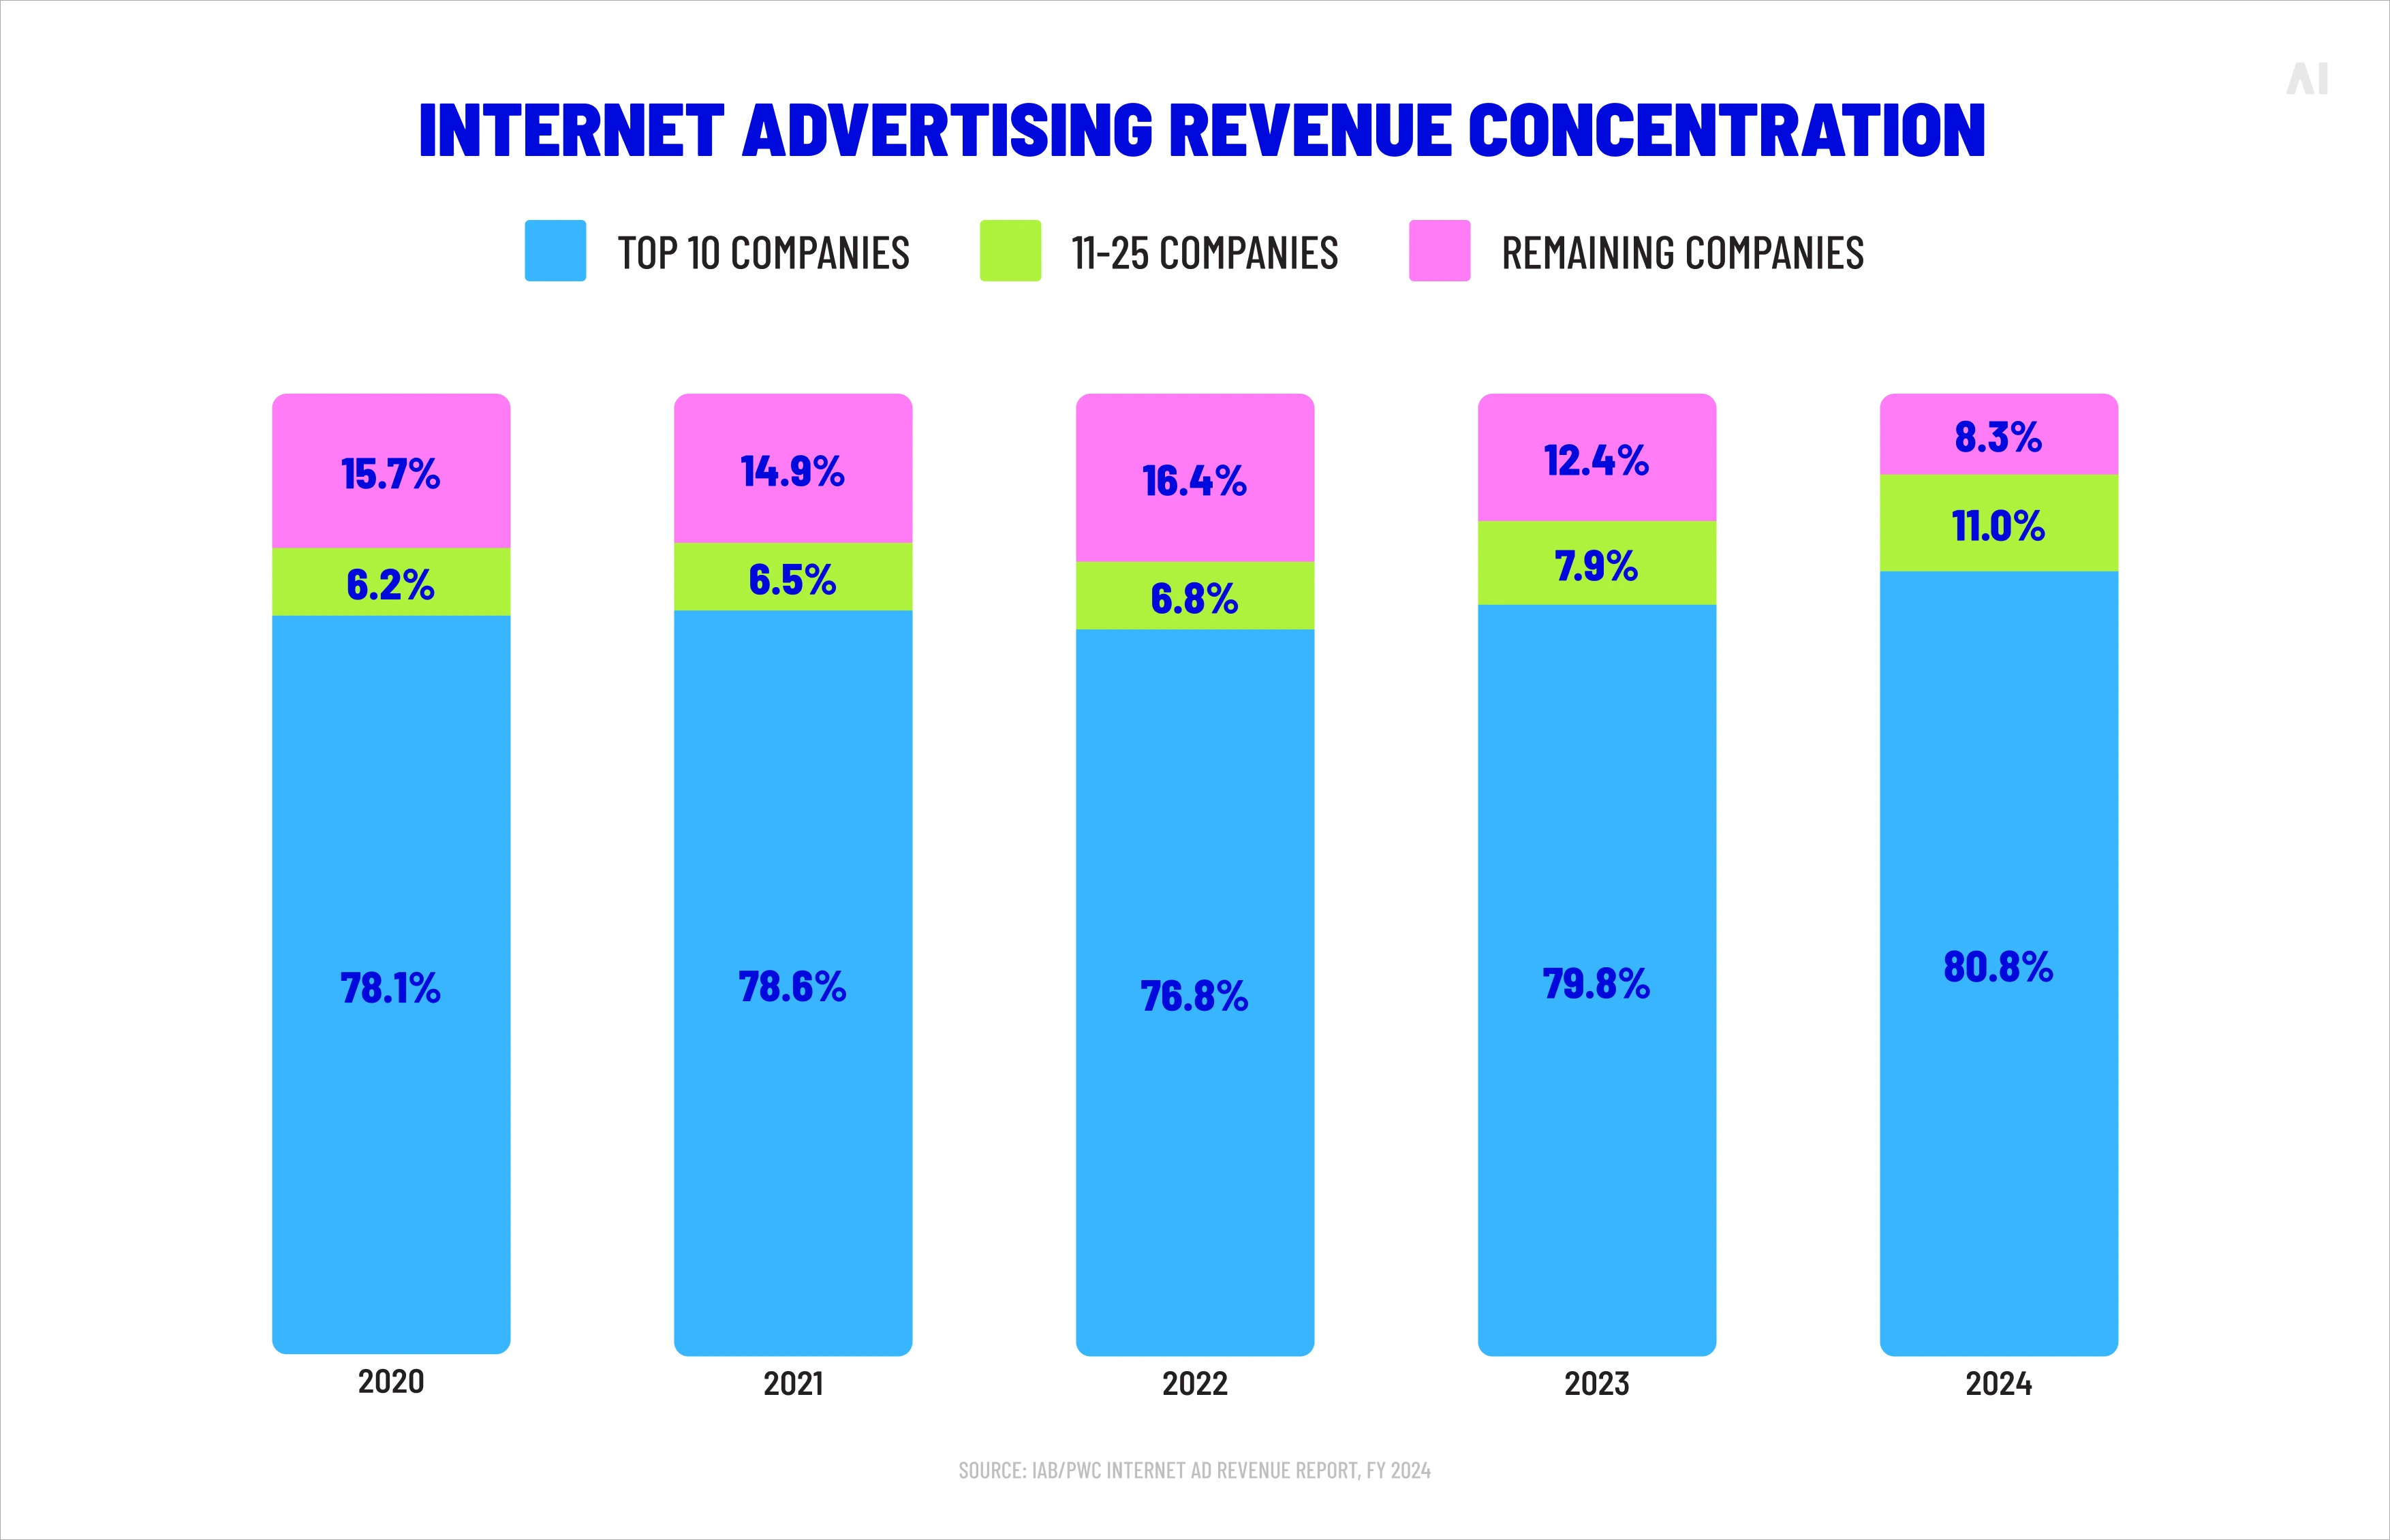
Major advertising platforms operate as walled gardens, environments where data, audiences, inventory, and measurement all remain inside the platform's perimeter. According to Statista, the world's largest walled gardens—including Alphabet, Meta, Amazon, Apple, TikTok, and Microsoft—accounted for approximately 78% of global digital advertising revenue in 2022, with that share projected to reach 83% by 2027. The IAB/PwC report confirmed that in 2024, the top ten companies alone controlled 80.8% of U.S. digital ad revenue.
{{26-Fragmented-Data-Cross-Platform-1="/tables"}}
Internet advertising revenue concentration (Source)
These platforms have a commercial incentive to keep advertisers within their ecosystems. Sharing granular performance data with competitors or enabling true cross-platform comparison would undermine their ability to claim disproportionate credit for conversions and justify premium pricing. Fragmentation is not a bug in the system. It is a feature of how the system is designed to operate.
{{26-Fragmented-Data-Cross-Platform-2="/tables"}}
As Tom Burke, VP of Growth at AI Digital, wrote: "The more tightly a media strategy is built around one platform, one path, or one way of activating inventory, the harder it becomes to adjust when the market moves. That can affect pricing, negotiating power, data flexibility, inventory access, and the ability to compare performance across environments with confidence."
When data is fragmented and metrics are inconsistent, the most fundamental requirement of media optimization—the ability to compare performance across channels—becomes impossible. This has consequences that cascade through every budget decision.
No consistent measurement baseline
Without standardized measurement, a marketer cannot objectively answer the question: which channel is delivering the most value per dollar spent? CTV might report strong completion rates. Paid social might report high engagement. Search might report strong click-through. But these metrics are not equivalent, and comparing them is like evaluating athletes across different sports using different scoring systems. Each one looks impressive in isolation, yet none can be ranked against the others with any confidence.
Platform bias distorts decision-making
Self-attributed reporting is inherently biased. Every platform has a financial incentive to present its own performance favourably, and the attribution models they use reflect that incentive. This leads to systematic over-investment in platforms that claim the most credit and under-investment in channels whose contribution is harder to measure—often upper-funnel and awareness-stage channels that initiate demand but do not close it.
Optimization becomes guesswork
When budget allocation decisions rely on incompatible data, optimization becomes reactive rather than strategic. Marketers shift spend toward whichever dashboard looks strongest, rather than toward the channel that genuinely drives incremental outcomes. This is not optimization. It is pattern-matching based on incomplete information.
Attribution models are supposed to answer the question of what drove a conversion. When data is fragmented, they cannot.
Platforms over-claim conversions
Each platform independently tracks user interactions and independently assigns credit for conversions. When a user is exposed to ads across three platforms before converting, all three may claim that conversion. TheANA's Q2 2025 Programmatic Transparency Benchmark estimated that $26.8 billion in global programmatic media value is lost each year to supply chain inefficiencies — and over-attribution is a core contributor to that waste, because it distorts the data marketers use to determine where that spend should go.
The conversion over-claim gap: what platforms report vs what actually happened
Cross-channel impact is invisible
In most multi-channel campaigns, individual channels influence each other. A display ad may create awareness that makes a search ad more effective. A social ad may drive consideration that leads to a direct site visit. These cross-channel dynamics are invisible when each platform only reports its own data. The marketer sees individual channel performance but cannot see how channels work together—or against each other.
Multi-touch models fail without unified data
Multi-touch attribution is designed to distribute credit across touchpoints proportionally. In theory, it solves the over-claiming problem. In practice, it requires a unified data set that connects user-level interactions across all channels, devices, and sessions. When underlying data is fragmented—different identifiers, different conversion definitions, different attribution windows—multi-touch models produce outputs that appear precise but rest on inconsistent inputs.
⚡ Fragmented data does not just reduce visibility. It actively misleads, creating a version of performance that looks coherent on each platform's dashboard but falls apart the moment you try to reconcile it with actual business results.
Frequency, reach, and audience overlap are invisible
Frequency management is one of the most direct casualties of cross-platform data silos. Without shared identity and aligned data, advertisers cannot see how many times the same person has been exposed to their message across channels—only how many times that person was reached within each individual platform.
The World Federation of Advertisers (WFA) reported that 80% of advertisers agree poor frequency control results in "advertising switch-off," where consumers tune out entirely. The same research found that campaigns now feature an average of nine different touchpoints, making cross-platform frequency management not just desirable but essential.
Without unified frequency data, the consequences are predictable. Some audience segments are saturated to the point of diminishing returns, while others remain underexposed. Reach figures are inflated because the same individual is counted separately in each platform's reporting. Audience suppression—removing recent converters from active targeting—fails because platforms cannot share conversion signals. The advertiser pays for impressions that either annoy existing customers or duplicate effort that has already been completed elsewhere.
The hidden cost of fragmented data
The economic impact of reporting fragmentation extends well beyond wasted impressions. It affects how budgets are structured, how campaigns are evaluated, and how acquisition costs are calculated.
The ANA's Q4 2025 Programmatic Transparency Benchmark provided the starkest illustration: advertisers enforcing disciplined quality governance converted 56.7% of their programmatic spend into benchmark-qualified impressions, while lower-performing advertisers converted just 37.5%. That 19-point gap is not explained by creative quality or audience strategy alone. It reflects the operational advantage of having unified, transparent data that enables informed decision-making at the impression level.
{{26-Fragmented-Data-Cross-Platform-3="/tables"}}
When data is fragmented, budgets are allocated based on which platform makes the strongest case for itself, not based on which channel genuinely contributes the most to business outcomes. Over time, this compounds into significant cost inflation. Customer acquisition costs rise because spend is being duplicated across channels that are reaching the same people. Campaign evaluation becomes unreliable because the metrics being compared are not comparable. And strategic planning is impaired because the organization lacks a coherent view of what is actually working.
Why more tools don’t fix the problem
A common response to data fragmentation is to add more technology — a customer data platform (CDP), a data management platform (DMP), a business intelligence layer, or an analytics suite that promises to unify everything.
These tools can help, but they do not solve the underlying problem if the data feeding into them remains structurally disconnected. A CDP that ingests data from five platforms with five different attribution models, five different conversion definitions, and five different identity systems will produce outputs that inherit all of those inconsistencies. The dashboard may look unified, but the data underneath is not.
The issue is not a shortage of tools. It is a shortage of alignment. As the ANA's benchmark programme has consistently shown, the marketers who achieve the strongest efficiency gains are not those with the most sophisticated tech stacks — they are those with the most disciplined approach to data governance, supply path transparency, and measurement standardisation. Technology enables that discipline. It does not replace it.
Before introducing any specific framework, it is worth being precise about what marketers actually need from their data infrastructure. The requirements are straightforward, even if achieving them is not.
Consistent measurement across channels. Every platform's contribution should be evaluated using the same definitions, the same attribution windows, and the same conversion criteria. Without this baseline, comparison is impossible.
Cross-platform visibility. Marketers need a single view of campaign performance that spans all active channels, not a collection of separate reports that must be manually reconciled.
Aligned attribution. Credit for conversions should be assigned based on actual contribution across the full user journey, not based on each platform's self-serving model. This requires deduplication and a unified data layer that connects touchpoints across environments.
Audience-level insight. Reach, frequency, and overlap should be measured at the audience level across platforms, not within each silo independently. This is the only way to manage exposure, suppress converters, and avoid duplication.
Decision-making based on comparable data. Budget allocation, creative rotation, and channel mix decisions should be grounded in data that has been normalized and aligned—not in platform-specific dashboards that each present their own version of reality.
AI Digital's Open Garden framework was built to address fragmentation at its root. Rather than adding another tool on top of disconnected data, Open Garden operates as a neutral, DSP-agnostic layer that aligns data, measurement, and execution across platforms.
The framework is structured around a simple principle: campaign decisions should be driven by the advertiser's business objectives, not by the constraints or commercial incentives of any individual platform. In practice, this means advertisers can evaluate and compare supply paths, attribution models, and audience strategies across environments using consistent criteria — something walled gardens are structurally unwilling to enable.
Open Garden is not a DSP and not a proprietary technology stack. It is an operating philosophy that restores choice, transparency, and competitive accountability to media buying. Advertisers working within the framework can access inventory across 15+ DSPs, evaluate performance using standardized measurement, and make allocation decisions based on what is genuinely driving outcomes rather than on which platform claims the most credit.
As Stephen Magli, CEO and Founder of AI Digital, wrote in AdExchanger: "The industry has fundamentally changed—the old way of buying media no longer reflects where consumers spend their time or how platforms actually operate. When your media strategy is engineered around your KPIs instead of a platform's commercial incentives, the performance gap becomes undeniable."
According to AI Digital's proprietary data, advertisers leveraging predictive analytics across open ecosystems are seeing 2.9x higher performance compared to single-platform approaches, while teams optimising in real time are generating 26% higher ROI and making decisions 73% faster than those operating within closed environments.
When measurement, identity, and attribution are aligned across platforms, the operational improvements are immediate and measurable.
Budget allocation becomes evidence-based. Instead of distributing spend according to platform-level reporting, marketers can evaluate each channel's contribution using the same yardstick. Underperforming channels are identified faster. High-performing channels receive investment that reflects their actual impact.
Waste is reduced. Unified frequency data prevents oversaturation. Audience deduplication eliminates redundant reach. Conversion deduplication stops multiple platforms from inflating their reported results. The ANA's Q3 2025 Benchmark illustrated this trajectory: marketers participating in structured transparency programmes reclaimed $13.6 billion in working media value as the share of ad spend reaching publishers rose to 47.1%, up 11 points since 2023.
Decision speed increases. When all performance data feeds into a single, normalized view, the time required to identify problems, evaluate options, and execute changes compresses significantly. Teams spend less time reconciling dashboards and more time acting on insights.
Strategic confidence grows. Marketers can defend budget decisions with data that holds up to scrutiny—not because the numbers are large, but because they are consistent, comparable, and grounded in a shared framework. That shift changes the dynamic between marketing teams and the executive stakeholders who fund them.
Conclusion: Data is only valuable if it works together
Programmatic channels are becoming the default for media buying across virtually every format. The volume of data generated by these systems is staggering, and it continues to grow.
None of that data delivers value if it cannot be unified, compared, and acted upon consistently. Data fragmentation in advertising is not a legacy problem that will resolve itself as technology improves. It is a structural feature of an ecosystem designed around walled gardens, self-serving attribution, and platform-level incentives that discourage transparency.
Transparency that stops at the demand layer is incomplete. If the industry is serious about accountability, supply deserves a far more central role in the conversation. — Britany Scott, AI Digital (POV)
The marketers who are gaining ground are the ones who have stopped treating fragmentation as an operational irritation and started treating it as a strategic problem that requires a structural solution. Unified data is not a luxury. It is the foundation on which effective cross-platform performance is built.
If fragmented data is limiting your ability to measure, compare, and optimize across channels, AI Digital can help. Through the Open Garden framework, managed services, and Elevate — our planning, optimization, and measurement platform — we help brands and agencies build media strategies around their business objectives, not around platform constraints. Get in touch!
• Platforms own AI models and train on proprietary data • Brands have little visibility into decision-making • "Walled gardens" restrict data access
• Inefficient ad spend • Limited strategic control • Eroded consumer trust • Potential budget mismanagement
Open Garden framework providing: • Complete transparency • DSP-agnostic execution • Cross-platform data & insights
Optimizing ads vs. optimizing impact
• AI excels at short-term metrics but may struggle with brand building • Consumers can detect AI-generated content • Efficiency might come at cost of authenticity
• Short-term gains at expense of brand health • Potential loss of authentic connection • Reduced effectiveness in storytelling
Smart Supply offering: • Human oversight of AI recommendations • Custom KPI alignment beyond clicks • Brand-safe inventory verification
The illusion of personalization
• Segment optimization rebranded as personalization • First-party data infrastructure challenges • Personalization vs. surveillance concerns
• Potential mismatch between promise and reality • Privacy concerns affecting consumer trust • Cost barriers for smaller businesses
Elevate platform features: • Real-time AI + human intelligence • First-party data activation • Ethical personalization strategies
AI-Driven efficiency vs. decision-making
• AI shifting from tool to decision-maker • Black box optimization like Google Performance Max • Human oversight limitations
• Strategic control loss • Difficulty questioning AI outputs • Inability to measure granular impact • Potential brand damage from mistakes
Managed Service with: • Human strategists overseeing AI • Custom KPI optimization • Complete campaign transparency
Fig. 1. Summary of AI blind spots in advertising
Dimension
Walled garden advantage
Walled garden limitation
Strategic impact
Audience access
Massive, engaged user bases
Limited visibility beyond platform
Reach without understanding
Data control
Sophisticated targeting tools
Data remains siloed within platform
Fragmented customer view
Measurement
Detailed in-platform metrics
Inconsistent cross-platform standards
Difficult performance comparison
Intelligence
Platform-specific insights
Limited data portability
Restricted strategic learning
Optimization
Powerful automated tools
Black-box algorithms
Reduced marketer control
Fig. 2. Strategic trade-offs in walled garden advertising.
Core issue
Platform priority
Walled garden limitation
Real-world example
Attribution opacity
Claiming maximum credit for conversions
Limited visibility into true conversion paths
Meta and TikTok's conflicting attribution models after iOS privacy updates
Data restrictions
Maintaining proprietary data control
Inability to combine platform data with other sources
Amazon DSP's limitations on detailed performance data exports
Cross-channel blindspots
Keeping advertisers within ecosystem
Fragmented view of customer journey
YouTube/DV360 campaigns lacking integration with non-Google platforms
Black box algorithms
Optimizing for platform revenue
Reduced control over campaign execution
Self-serve platforms using opaque ML models with little advertiser input
Performance reporting
Presenting platform in best light
Discrepancies between platform-reported and independently measured results
Consistently higher performance metrics in platform reports vs. third-party measurement
Fig. 1. The Walled garden misalignment: Platform interests vs. advertiser needs.
Key dimension
Challenge
Strategic imperative
ROAS volatility
Softer returns across digital channels
Shift from soft KPIs to measurable revenue impact
Media planning
Static plans no longer effective
Develop agile, modular approaches adaptable to changing conditions
Brand/performance
Traditional division dissolving
Create full-funnel strategies balancing long-term equity with short-term conversion
Capability
Key features
Benefits
Performance data
Elevate forecasting tool
• Vertical-specific insights • Historical data from past economic turbulence • "Cascade planning" functionality • Real-time adaptation
• Provides agility to adjust campaign strategy based on performance • Shows which media channels work best to drive efficient and effective performance • Confident budget reallocation • Reduces reaction time to market shifts
• Dataset from 10,000+ campaigns • Cuts response time from weeks to minutes
• Reaches people most likely to buy • Avoids wasted impressions and budgets on poor-performing placements • Context-aligned messaging
• 25+ billion bid requests analyzed daily • 18% improvement in working media efficiency • 26% increase in engagement during recessions
Full-funnel accountability
• Links awareness campaigns to lower funnel outcomes • Tests if ads actually drive new business • Measures brand perception changes • "Ask Elevate" AI Chat Assistant
• Upper-funnel to outcome connection • Sentiment shift tracking • Personalized messaging • Helps balance immediate sales vs. long-term brand building
• Natural language data queries • True business impact measurement
Open Garden approach
• Cross-platform and channel planning • Not locked into specific platforms • Unified cross-platform reach • Shows exactly where money is spent
• Reduces complexity across channels • Performance-based ad placement • Rapid budget reallocation • Eliminates platform-specific commitments and provides platform-based optimization and agility
• Coverage across all inventory sources • Provides full visibility into spending • Avoids the inability to pivot across platform as you’re not in a singular platform
Fig. 1. How AI Digital helps during economic uncertainty.
Trend
What it means for marketers
Supply & demand lines are blurring
Platforms from Google (P-Max) to Microsoft are merging optimization and inventory in one opaque box. Expect more bundled “best available” media where the algorithm, not the trader, decides channel and publisher mix.
Walled gardens get taller
Microsoft’s O&O set now spans Bing, Xbox, Outlook, Edge and LinkedIn, which just launched revenue-sharing video programs to lure creators and ad dollars. (Business Insider)
Retail & commerce media shape strategy
Microsoft’s Curate lets retailers and data owners package first-party segments, an echo of Amazon’s and Walmart’s approaches. Agencies must master seller-defined audiences as well as buyer-side tactics.
AI oversight becomes critical
Closed AI bidding means fewer levers for traders. Independent verification, incrementality testing and commercial guardrails rise in importance.
Fig. 1. Platform trends and their implications.
Metric
Connected TV (CTV)
Linear TV
Video Completion Rate
94.5%
70%
Purchase Rate After Ad
23%
12%
Ad Attention Rate
57% (prefer CTV ads)
54.5%
Viewer Reach (U.S.)
85% of households
228 million viewers
Retail Media Trends 2025
Access Complete consumer behaviour analyses and competitor benchmarks.
Identify and categorize audience groups based on behaviors, preferences, and characteristics
Michaels Stores: Implemented a genAI platform that increased email personalization from 20% to 95%, leading to a 41% boost in SMS click through rates and a 25% increase in engagement.
Estée Lauder: Partnered with Google Cloud to leverage genAI technologies for real-time consumer feedback monitoring and analyzing consumer sentiment across various channels.
High
Medium
Automated ad campaigns
Automate ad creation, placement, and optimization across various platforms
Showmax: Partnered with AI firms toautomate ad creation and testing, reducing production time by 70% while streamlining their quality assurance process.
Headway: Employed AI tools for ad creation and optimization, boosting performance by 40% and reaching 3.3 billion impressions while incorporating AI-generated content in 20% of their paid campaigns.
High
High
Brand sentiment tracking
Monitor and analyze public opinion about a brand across multiple channels in real time
L’Oréal: Analyzed millions of online comments, images, and videos to identify potential product innovation opportunities, effectively tracking brand sentiment and consumer trends.
Kellogg Company: Used AI to scan trending recipes featuring cereal, leveraging this data to launch targeted social campaigns that capitalize on positive brand sentiment and culinary trends.
High
Low
Campaign strategy optimization
Analyze data to predict optimal campaign approaches, channels, and timing
DoorDash: Leveraged Google’s AI-powered Demand Gen tool, which boosted its conversion rate by 15 times and improved cost per action efficiency by 50% compared with previous campaigns.
Kitsch: Employed Meta’s Advantage+ shopping campaigns with AI-powered tools to optimize campaigns, identifying and delivering top-performing ads to high-value consumers.
High
High
Content strategy
Generate content ideas, predict performance, and optimize distribution strategies
JPMorgan Chase: Collaborated with Persado to develop LLMs for marketing copy, achieving up to 450% higher clickthrough rates compared with human-written ads in pilot tests.
Hotel Chocolat: Employed genAI for concept development and production of its Velvetiser TV ad, which earned the highest-ever System1 score for adomestic appliance commercial.
High
High
Personalization strategy development
Create tailored messaging and experiences for consumers at scale
Stitch Fix: Uses genAI to help stylists interpret customer feedback and provide product recommendations, effectively personalizing shopping experiences.
Instacart: Uses genAI to offer customers personalized recipes, mealplanning ideas, and shopping lists based on individual preferences and habits.
Medium
Medium
Share article
Url copied to clipboard
No items found.
Subscribe to our Newsletter
THANK YOU FOR YOUR SUBSCRIPTION
Oops! Something went wrong while submitting the form.
Questions? We have answers
Why is fragmented data such a big issue?
Because it prevents marketers from comparing performance across channels using consistent criteria. When every platform defines metrics differently, uses its own attribution model, and reports in isolation, budget decisions are based on incompatible data. The result is misallocated spend, inflated acquisition costs, and a false sense of what is actually driving business outcomes.
Can attribution models solve this problem?
Not on their own. Attribution models require unified, consistent data to function properly. When the underlying inputs are fragmented—different conversion definitions, mismatched identity graphs, conflicting attribution windows—even sophisticated multi-touch models produce unreliable outputs. Attribution is a methodology, not a substitute for data alignment.
Do CDPs or DMPs fix data fragmentation?
They can help organise and centralise data, but they do not fix the structural disconnection between platforms. A CDP that ingests data from five platforms with five different measurement standards will reflect those inconsistencies in its outputs. The technology is valuable when paired with standardized measurement and aligned data governance, but it is not a standalone solution.
Is this only a problem for large advertisers?
No. In fact, smaller advertisers and agencies often feel the impact more acutely. Large organizations can absorb fragmentation by building dedicated teams and proprietary infrastructure. Smaller teams lack that capacity, yet they still need to run effective cross-channel campaigns. For them, fragmentation compresses margins, slows optimization, and limits the ability to compete with better-resourced competitors.
How does Open Garden address fragmented data?
Open Garden operates as a neutral, DSP-agnostic framework that aligns data, measurement, and execution across platforms. Instead of relying on each platform's self-reported metrics, it applies consistent measurement standards and enables cross-platform comparison based on the advertiser's business objectives. This restores the ability to evaluate, compare, and optimize across channels—the capability that fragmentation takes away.
How does data fragmentation in advertising lead to performance distortion?
Data fragmentation in advertising creates performance distortion by forcing marketers to evaluate results through incompatible reporting systems. When each platform defines conversions differently, applies its own attribution logic, and reports in isolation, the resulting performance picture is structurally skewed. Channels that capture last-click credit appear to outperform channels that initiate demand, budgets migrate toward platforms that claim the most credit rather than those that create the most value, and aggregate reporting inflates total conversions well beyond what the business actually records. The distortion is not caused by bad data within any single platform—it is caused by the absence of a shared framework that allows data to be compared, deduplicated, and interpreted consistently across the full media mix.
What is the difference between data silos and data fragmentation?
Data silos in digital advertising refer to the isolated environments where platform-specific data is stored and reported—Meta's dashboard, Google's dashboard, a DSP's interface, and so on. Each silo contains real, accurate data about what happened within that platform. Data fragmentation in advertising is the broader structural problem that results from those silos existing independently: metrics are defined inconsistently, attribution models conflict, user identities cannot be resolved across channels, and no single view of performance exists. In other words, silos are the containers; fragmentation is what happens when those containers cannot communicate. Eliminating silos by centralising data into a single tool does not automatically solve fragmentation—the underlying definitions, models, and identity systems must also be aligned for the data to become genuinely unified and actionable.
Have other questions?
If you have more questions, contact us so we can help.


.svg)
.svg)