Retail Forecasting: A Guide to Smarter Planning, Media, and Growth
Sarah Moss
April 17, 2026
14
minutes read
Forecasting in retail is how teams turn demand signals into smarter commitments—what to stock, what to promote, and where to put budget before the week gets away from you. Done well, it connects marketing performance, inventory reality, and revenue targets into one forward-looking plan you can adjust as conditions change.
Retail forecasting used to be treated as an operations problem: estimate demand, order inventory, hope markdowns don’t get ugly. In 2026 and beyond, that view is too narrow. The modern retail forecast has to connect three systems that influence each other every day:
Demand signals (what shoppers are doing and likely to do next)
Marketing performance (what spend is producing, by channel and audience)
Revenue planning (how those signals roll up into targets, margin, and cash)
What changed is not just the amount of data. It’s the speed of feedback. Media performance arrives in hours, not weeks. Promotions can be launched or paused quickly. Supply constraints and lead times are still real, but decision cycles have shortened.
This guide explains what retail forecasting is, the major forecasting types, and the methods teams use—from traditional models to predictive AI. It then gets practical: how to build a forecast you can actually run the business on, and how to turn forecasting into a growth habit rather than a once-a-quarter spreadsheet exercise.
⚡ A forecast only matters if it changes a decision before money is committed.
What is retail forecasting?
At its core, retail forecasting uses historical data, market signals, and increasingly media and customer behaviour insights to anticipate demand, revenue, and performance outcomes. The aim has never been perfect prediction. It's a forecast reliable enough to act on—one anchored to the levers you can actually pull.
The clearest way to understand retail forecasting is to contrast it with two activities that often get confused with it:
Reporting looks backward. It tells you what happened.
Static planning locks assumptions in place. It tells you what you hoped would happen.
Retail forecasting looks forward and stays adjustable. It tells you what is likely to happen if conditions stay the same—and what changes when you adjust the inputs (pricing, promo depth, media spend, inventory availability, channel mix).
{{26-Retail-Demand-Forecasting-1="/tables"}}
💡 If you’re aligning forecasting to broader retail growth, it helps to ground it in a full retail digital marketing system—how channels, data, creative, and measurement work together to drive demand instead of simply recording it.
The core types of retail forecasting
The fastest way to make forecasting useful is to stop treating it as one monolithic model. Retail teams forecast different things for different decisions, and those forecasts are best managed as a coordinated set.
💡 Before the breakdown, one practical note: this section pairs well with a data-driven strategy approach. If you’re building the wider operating model (objectives, KPIs, governance, and measurement), you’ll want a companion piece like Creating a data-driven marketing strategy. It also helps to understand how forecasting fits into modern media planning and buying, because a growing share of demand is influenced by decisions made in ad platforms and auction dynamics, not just in merchandising calendars.
Here’s the simplest way to categorize forecasting in retail without losing nuance:
{{26-Retail-Demand-Forecasting-2="/tables"}}
This breakdown is useful because each type has different inputs, different time horizons, and different error costs. A forecasting approach that’s “good enough” for staffing can be unacceptable for a high-stakes seasonal buy.
Sales and demand forecasting
Sales and demand forecasting predicts how much you’re likely to sell, when, and under what conditions. It typically operates at multiple levels:
Total business (revenue, units)
Category and subcategory
SKU, variant, or store cluster
Time buckets (daily, weekly, monthly)
The immediate value is obvious: you can’t plan inventory without an estimate of demand. The less obvious value is that sales and demand forecasting is where you test business logic.
For example, if demand is expected to grow, you need to know whether that growth is coming from:
Traffic increases (more people showing up)
Conversion improvements (more people buying)
Basket changes (AOV up or down)
Price/mix shifts (more premium items, fewer discounts, different bundles)
Those drivers determine what you should do next. A forecast that only outputs a revenue line might be accurate yet still unhelpful, because it doesn’t tell you how the outcome is being created.
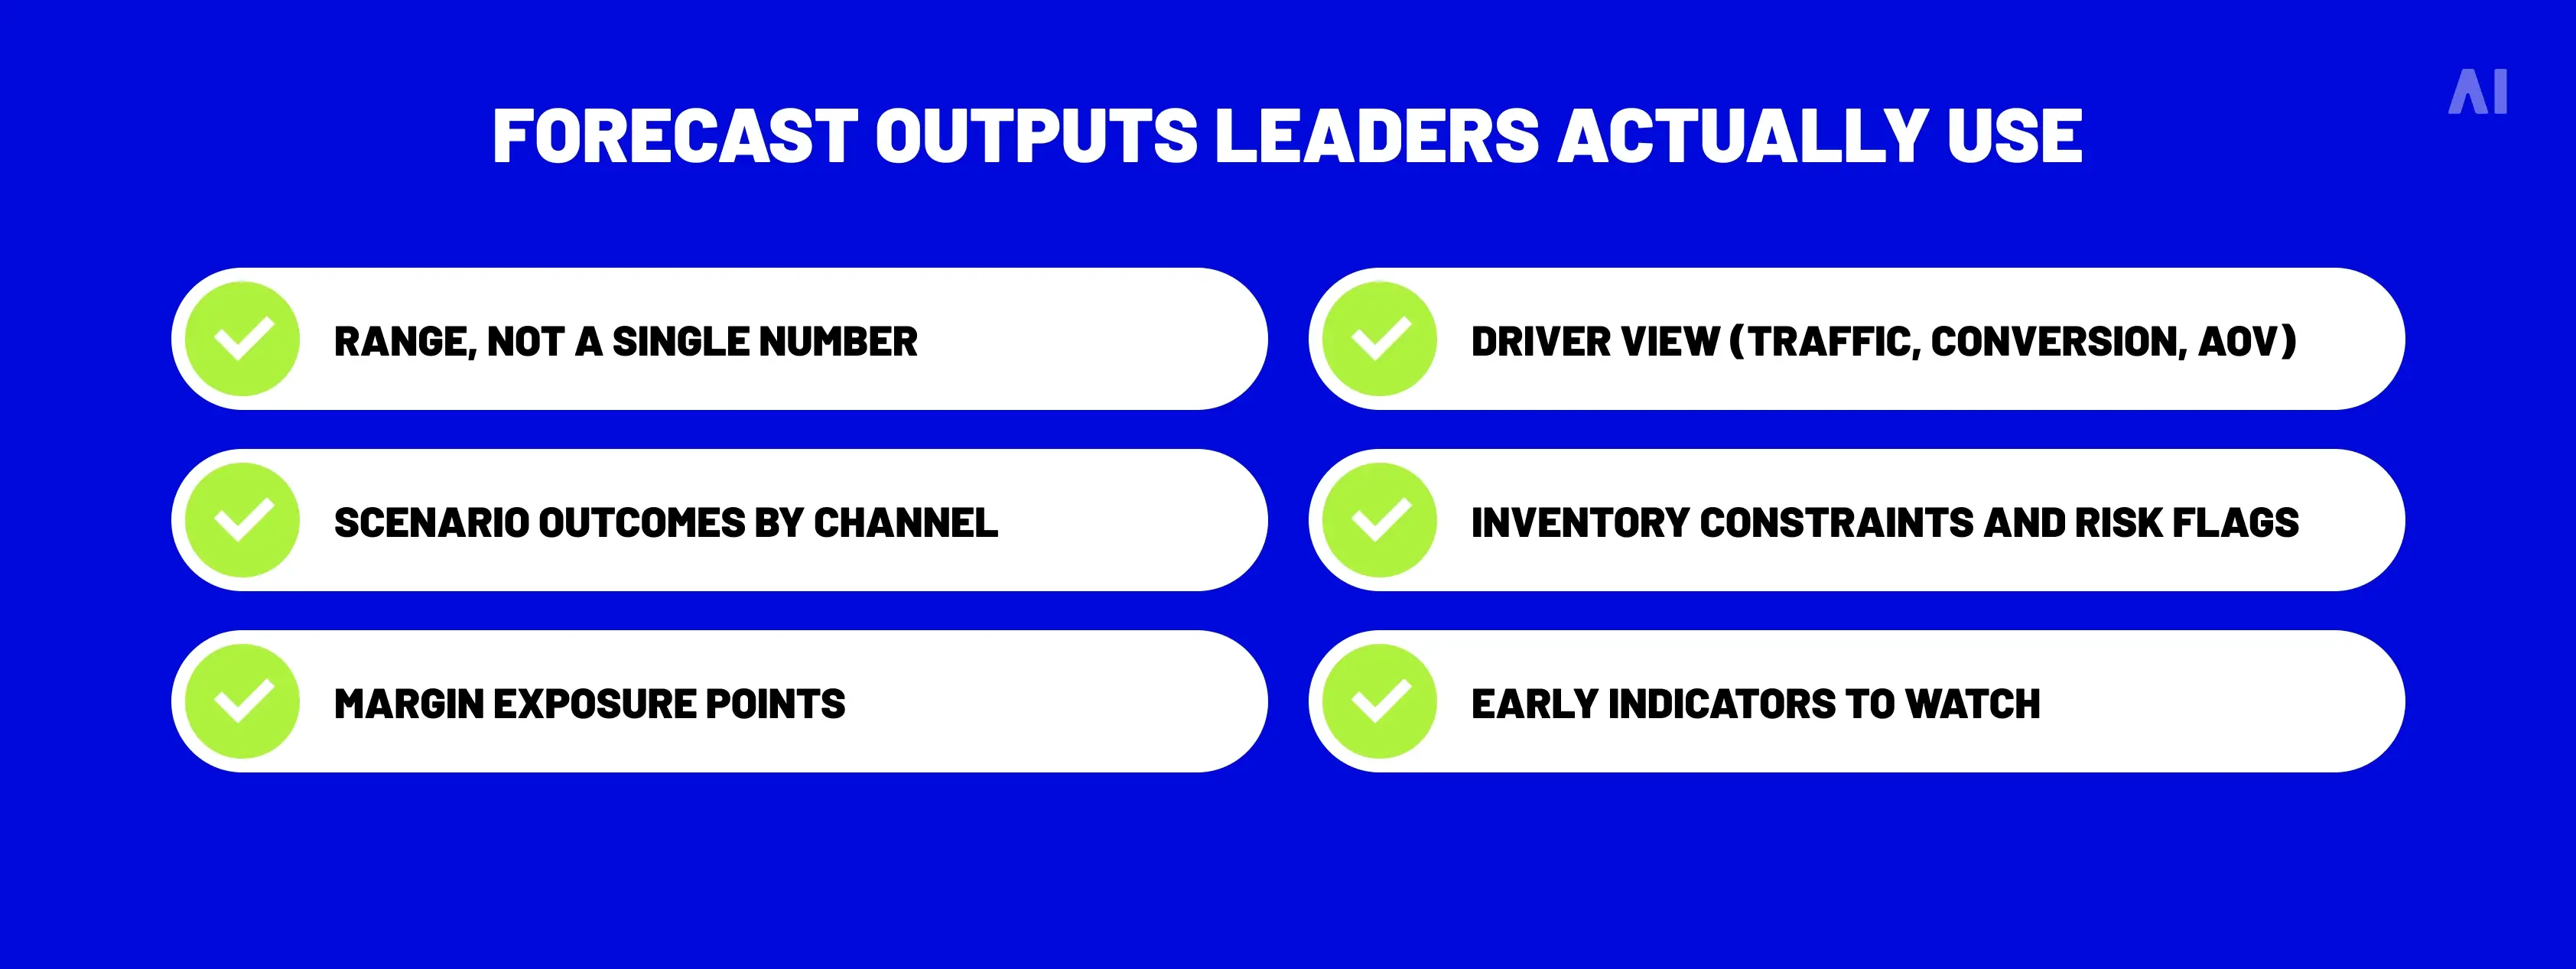
To make demand forecasting more usable, start by adding a short “driver view” alongside the forecast:
That driver view turns the forecast into a planning tool rather than a number finance approves and everyone else hopes is right.
Marketing and media forecasting
Marketing and media forecasting predicts what performance looks like before you spend the money. That includes outcomes such as:
Expected sales lift (direct and indirect)
Customer acquisition volume at different spend levels
ROAS or MER ranges by channel
Incremental lift estimates when you have test/control capability
Pacing and saturation risk (when more budget stops helping)
This is where forecasting becomes a growth discipline, because it forces teams to quantify trade-offs:
If we shift budget from paid social to retail media, what changes?
If we move more into CTV for reach, how does that affect short-term performance?
If we promote earlier, do we pull demand forward or create true incremental sales?
💡 Media forecasting depends on ad platforms and measurement systems, which is why it sits close to the adtech ecosystem. Understanding how auctions, targeting, and optimization work improves the quality of the forecast inputs.
The most useful framing for media forecasting is scenario modelling. You're laying out plausible futures side by side and choosing your commitments based on what you can defend.
⚡ Forecasting doesn't predict what will happen. It helps you weigh what a decision will cost before you've already made it.
Customer behavior forecasting
Customer behavior forecasting predicts what shoppers are likely to do next—repeat, churn, react to a promo, upgrade, lapse, or respond to a specific message. It’s the bridge between short-term performance and long-term growth.
This category includes models and rules such as:
Churn risk or reactivation likelihood
Next purchase timing
Category affinity and cross-sell probability
Predicted lifetime value direction (not just current LTV)
Offer sensitivity and promo responsiveness
Customer behavior forecasting becomes especially valuable when you’re trying to grow profitably. Acquisition can be scaled with spend. Retention and margin are harder, and they’re where forecasting helps you stop wasting incentives.
💡 Because behavior forecasting often feeds personalization, it ties closely to AI-driven personalization systems—how models decide who to show what, in which channel, and at what time.
Strategic decisions enabled by retail forecasting
Retail forecasting influences strategy because it changes how confidently you can make commitments across revenue, inventory, pricing, and media. The forecast becomes a “decision engine” when it answers the questions leaders actually have:
What outcomes are realistic if we keep the same strategy?
What happens if we change a lever (promo depth, channel mix, inventory availability)?
What risks are we accepting, and what’s our mitigation plan?
Below are the decisions most directly improved by forecasting, along with how to frame them.
Revenue planning that admits uncertainty
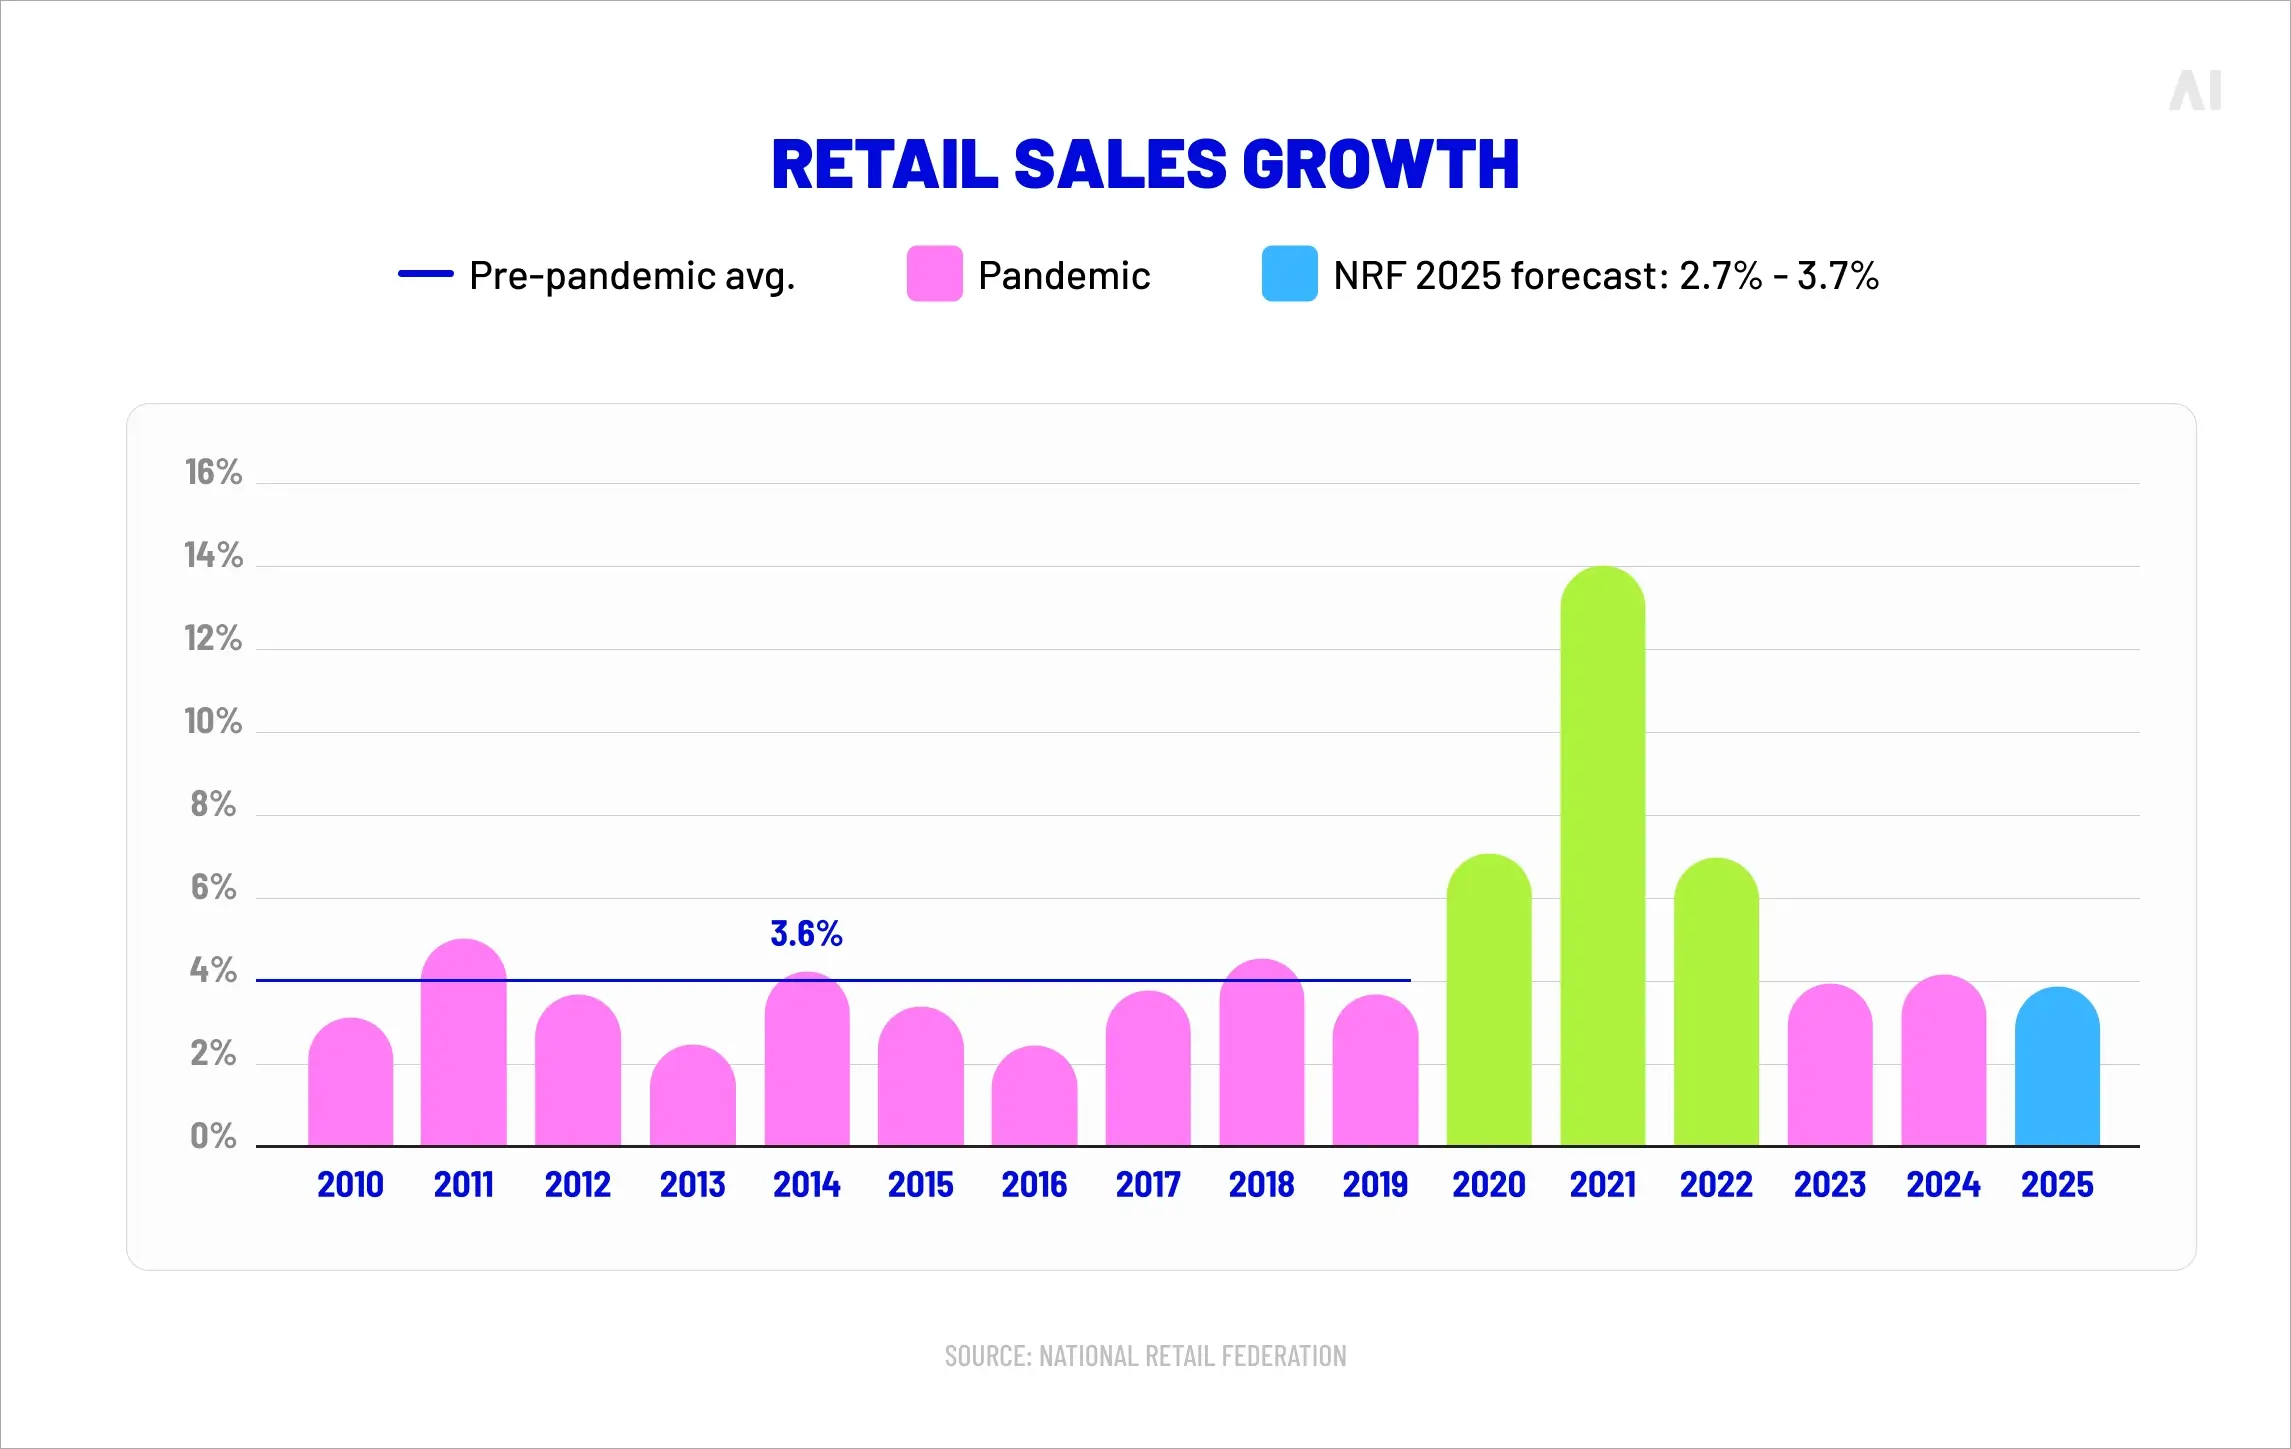
A forecast that claims certainty is usually hiding assumptions. A better forecast shows ranges, confidence, and what would need to be true for the upside case to happen.
NRF’s 2025 outlook is a good example of how credible planning is often expressed as a range rather than a single-point estimate: U.S. retail sales were forecast to grow between 2.7% and 3.7% over 2024, reaching roughly $5.42–$5.48 trillion.
The exact number matters less than the discipline behind it. Plan for a base case, define a tight set of alternate outcomes, and tie your actions to early indicators that tell you which scenario is unfolding.
Inventory balance that matches demand shape
Inventory decisions fail when they assume demand is smooth. It isn’t. Demand moves with promotions, weather, competitor actions, and channel shifts.
Retailers’ inventories-to-sales ratio (months of inventory proxy; Source)
A practical forecasting approach links demand forecasts to inventory policies:
Safety stock rules by volatility
Reorder points tied to lead times
Allocation logic when supply is constrained
Markdown timing based on sell-through probability
This is also where “bad data” becomes expensive. If inventory availability isn’t reliably reflected in your forecasting inputs, you end up forecasting demand you can’t fulfill—and then blaming marketing for the gap.
Pricing and promotion strategy that avoids self-inflicted chaos
Promotions are a forecasting stress test. They distort baseline demand, change basket mix, and create operational strain. Forecasting makes promotions safer by answering two questions:
What is the expected lift versus baseline?
How much of that lift is incremental versus pulled-forward demand?
That second question matters because pulled-forward demand looks great in the moment and then shows up later as a slump. A forecasting discipline that tracks post-promo decay helps teams stop repeating the same mistake with different creative.
Retail media investment timing
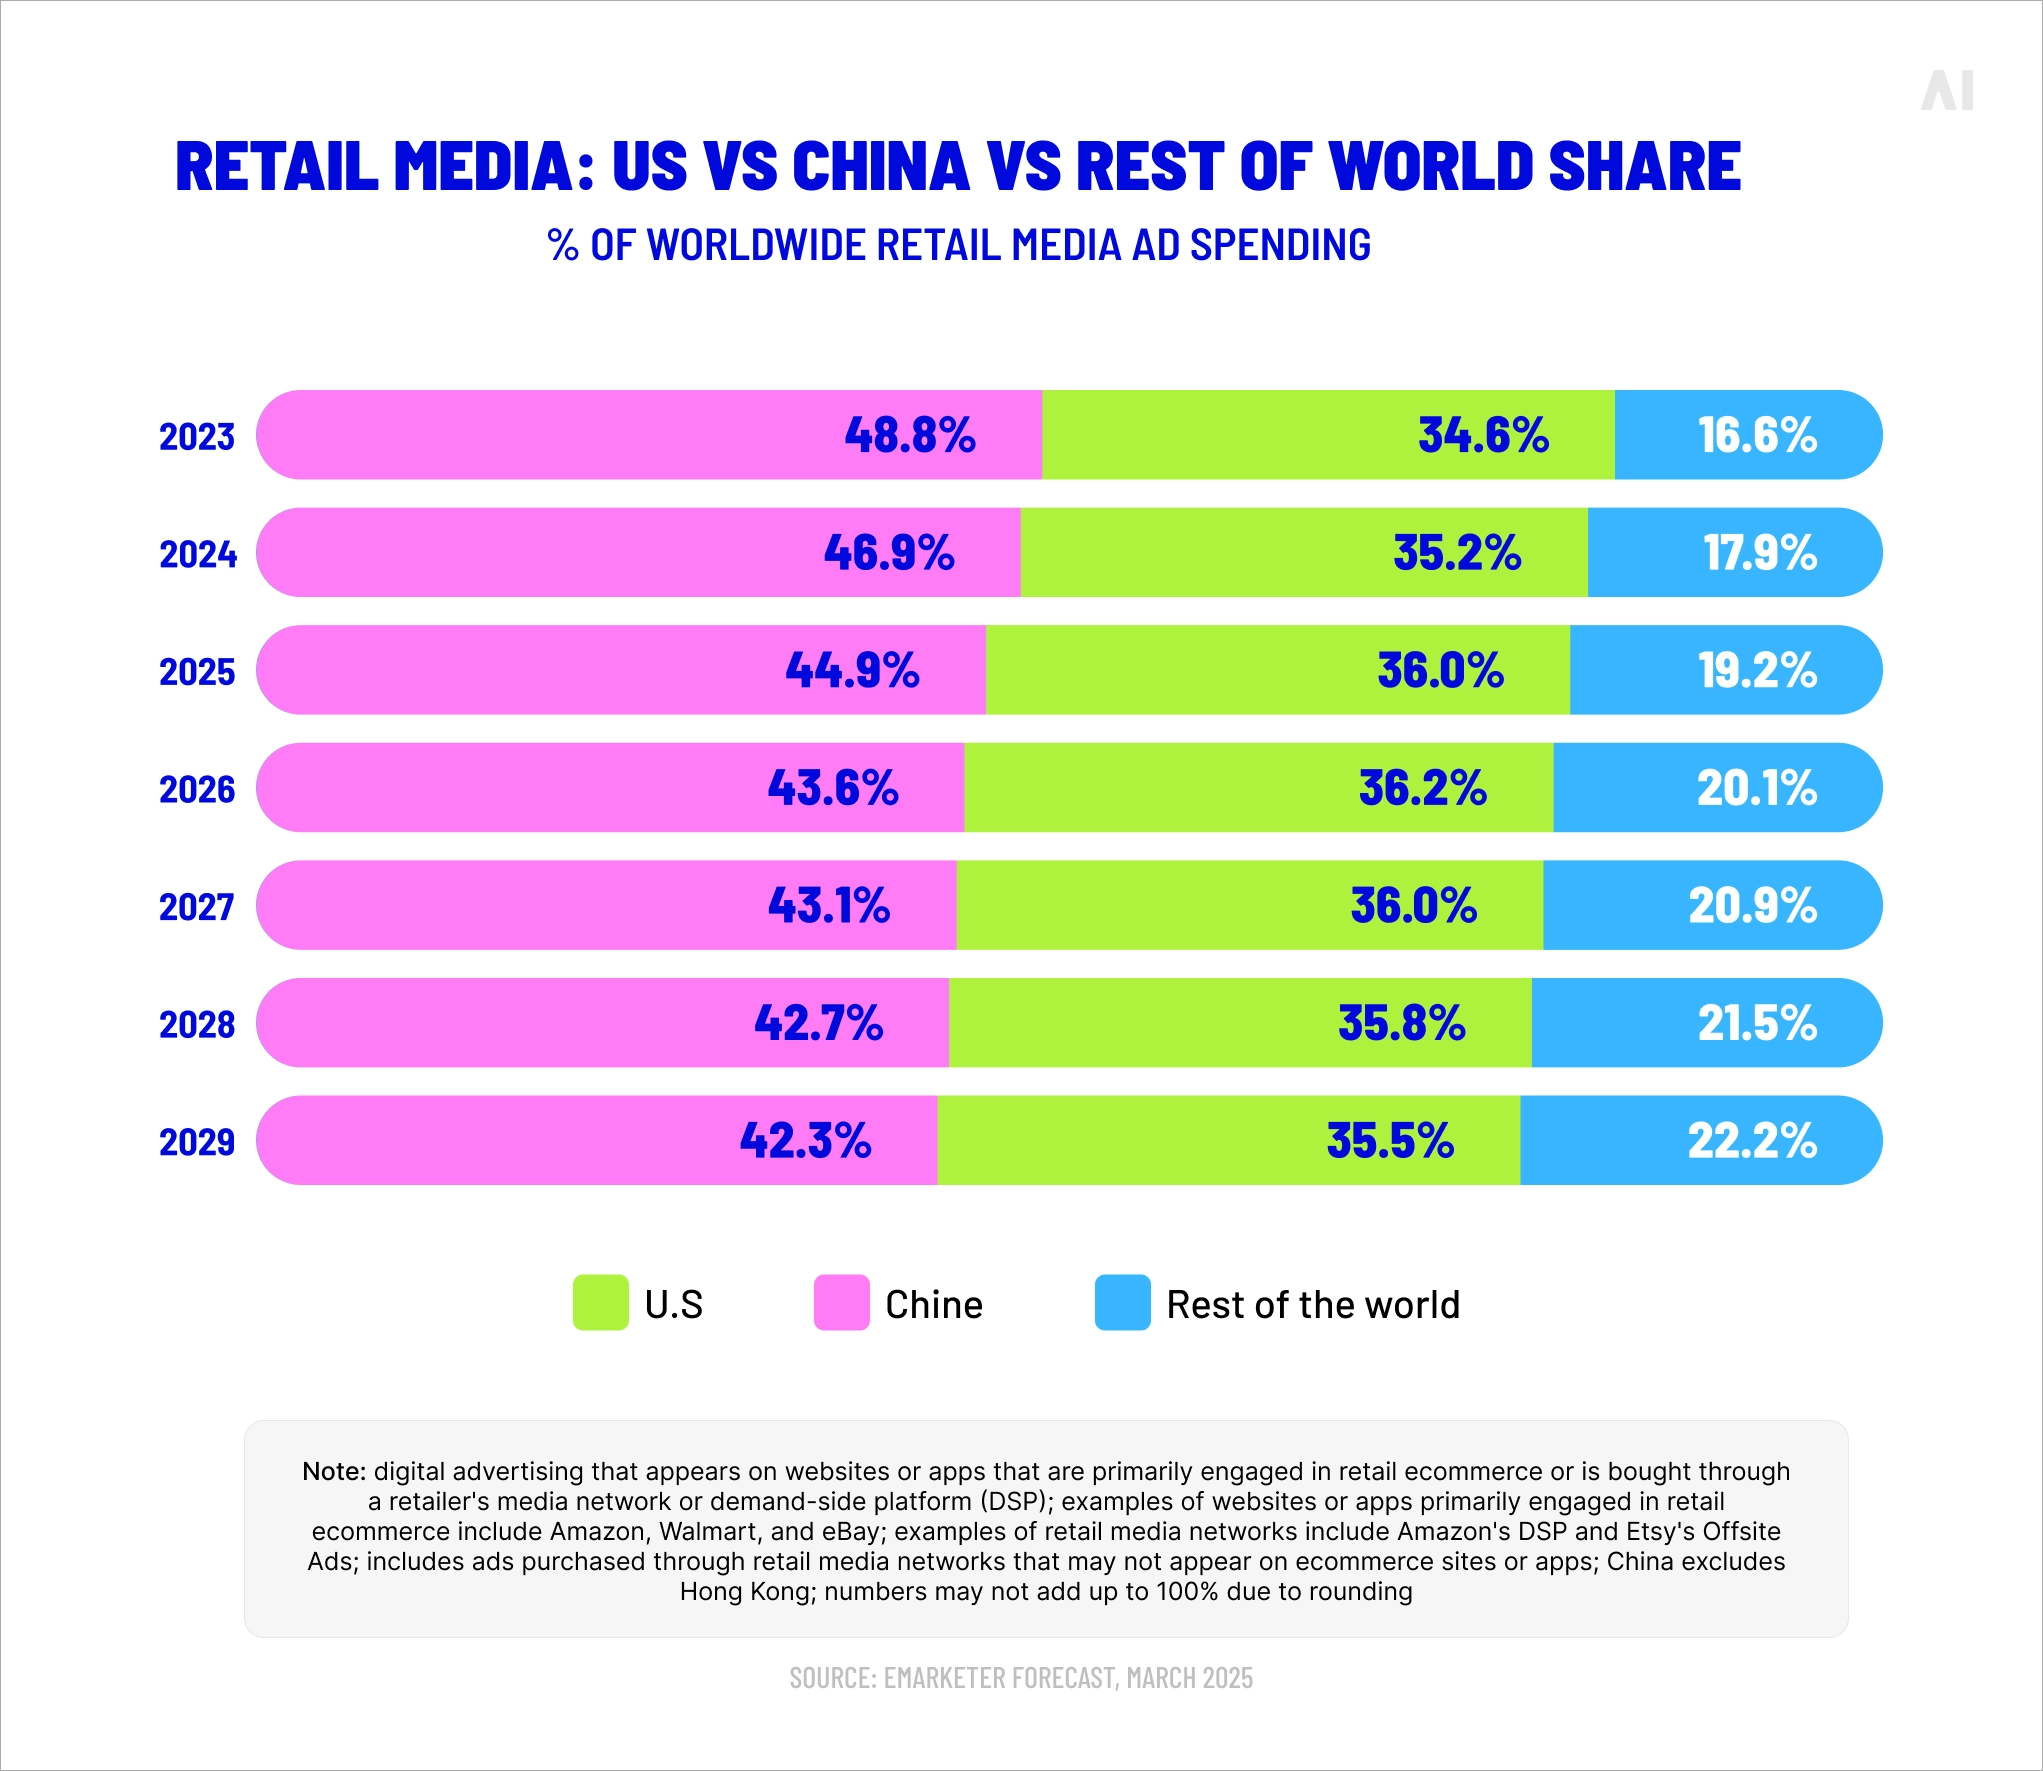
Retail media changes forecasting because it provides shopper data and conversion signals close to purchase. It also changes budget behavior: teams move money faster when they can see outcomes faster.
Retail media: US vs China vs rest of world share (2023–2029; Source)
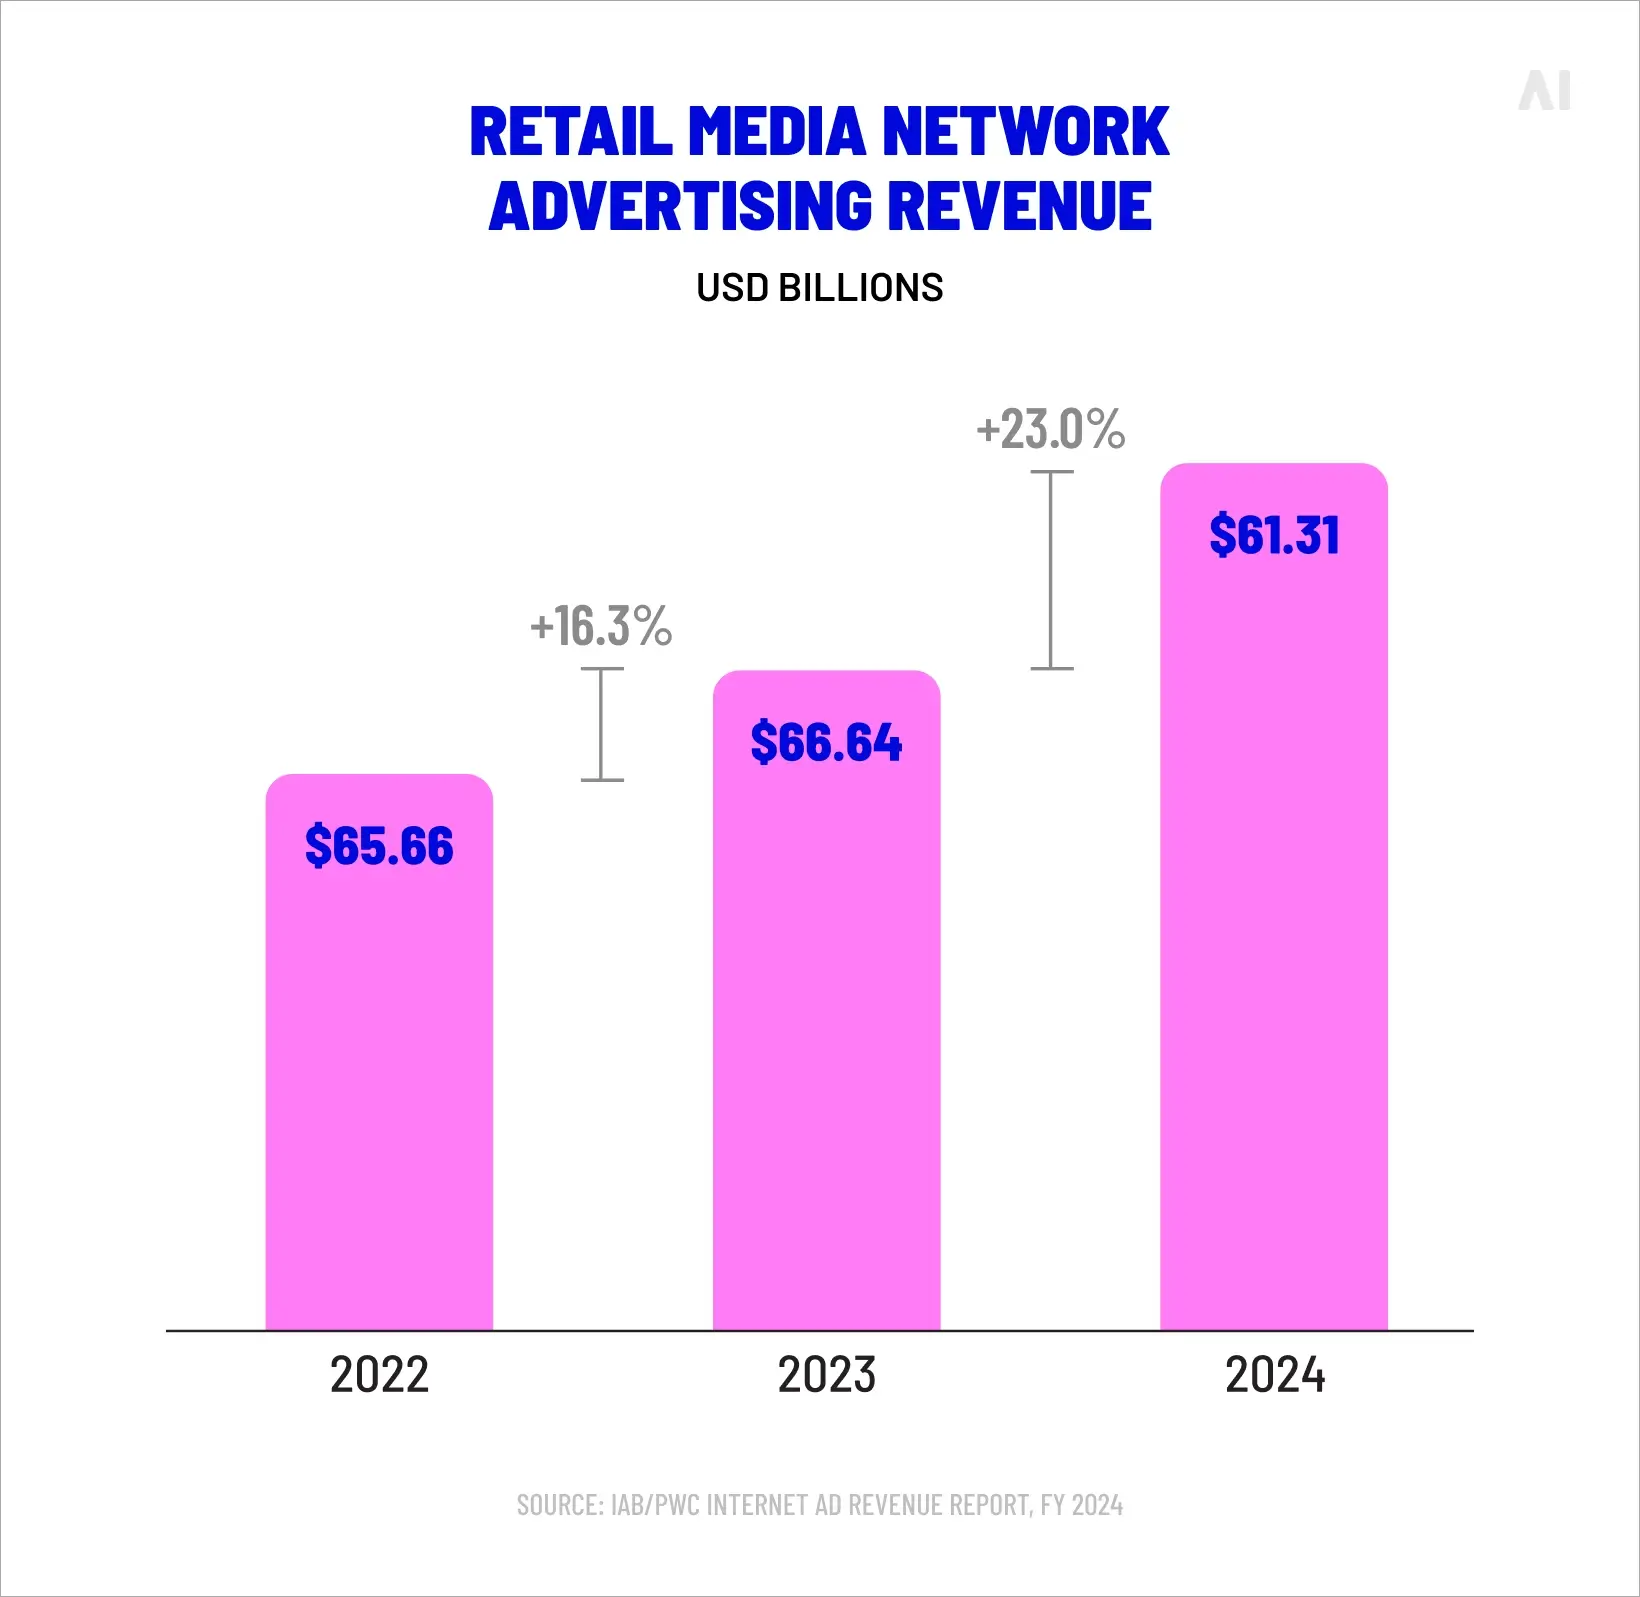
In 2025, U.S. retail media spend was forecast to be roughly $58.79B, with growth continuing into 2026. At that scale, retail media has moved well beyond niche tactic status—it now functions as part of the core demand engine for many retailers and brands.
Forecasting helps you decide:
How much budget should sit in “always-on” demand capture
How much should be reserved for seasonal surges
When to invest in upper-funnel channels that feed retail media outcomes later
💡 If you want a deeper breakdown of how retail media networks operate and why their measurement is structured differently, AI Digital’s overview of RMNs is a helpful primer.
Retail is now structurally multichannel. Even when you sell primarily in-store, online behavior affects in-store demand.
The U.S. Census Bureau’s quarterly e-commerce report illustrates this shift in a tangible way: in Q3 2025, e-commerce accounted for 15.8% of total retail sales, with e-commerce growing faster than total retail.
Forecasting turns that kind of signal into action by asking: if digital demand is growing faster, are we forecasting the right fulfillment load, customer support volume, and media mix?
The data and technology behind accurate forecasts
Forecast accuracy depends on inputs more than algorithms. Better modeling helps, but only after you’re confident in what’s flowing into the model.
A clear way to think about forecast inputs is to group them into four categories:
Commerce performance data (sales, units, conversion, basket, returns)
Pricing and promotion signals (price changes, promo depth, calendar effects)
Customer and audience signals (segments, repeat behavior, loyalty, propensity)
Media and supply path signals (delivery, quality, cost dynamics, audience reach)
{{26-Retail-Demand-Forecasting-3="/tables"}}
The fourth category is often underweighted in retail forecasting. Yet media delivery quality and cost dynamics directly shape demand creation, especially when you rely heavily on programmatic buying and retail media.
Why DSP intelligence matters
Forecasts break when paid media performance gets treated as a fixed input. In reality, cost and delivery are influenced by auctions, targeting constraints, creative fatigue, and inventory access.
💡 That’s why AI inside DSPs matters: it affects how spend translates into reach and conversions, and it can change performance quickly when algorithms shift.
What this means for forecasting is simple. Your assumptions should move at the same speed as your media reality. When costs rise, inventory access shifts, or a platform throttles delivery, the forecast needs to reflect that before you make your next commitment.
Why supply chain transparency matters (even for forecasting)
“Supply chain” in this section isn’t about pallets. It’s about the digital advertising supply chain—the path your budget takes before it becomes an impression, a click, or a conversion.
If you assume media quality is consistent but your supply path is not, your forecast will drift. You’ll attribute performance changes to seasonality or creative when the real issue is that you’re buying different inventory through a different route.
💡 For a clear breakdown of how the digital advertising supply chain works and where value can leak, see AI Digital’s explainer.
The role of AI as a practical tool, not a buzzword
AI improves forecasting in two ways:
It can detect non-obvious patterns (combinations of signals that correlate with demand shifts).
It can update more frequently without forcing analysts to rebuild models constantly.
In a 2025 supply chain survey summary, ABI Research noted that many leaders consider AI capabilities important in technology decisions, reflecting broader momentum toward AI-assisted planning.
This doesn't require an all-in bet on AI. It does require acknowledging that planning cycles are accelerating faster than manual workflows can comfortably handle.
Retail forecasting methods: from traditional models to predictive AI
Forecasting methods sit on a spectrum. Most retailers use a combination, even if they don’t label it that way, because different decisions need different levels of precision, speed, and explainability.
A useful rule is to match methods to decision risk.
Low-risk decisions (light promo tweaks, weekly staffing adjustments, minor budget shifts) can rely on simpler models that are easy to explain and maintain.
High-risk decisions (seasonal buys, big promo calendar changes, major channel reallocation, new market launches) need deeper scenario work, tighter monitoring, and faster refresh cycles.
{{26-Retail-Demand-Forecasting-4="/tables"}}
One more practical distinction: as you move along the spectrum, you’re not only changing the model. You’re changing the operating rhythm around it—how often inputs update, how quickly you detect drift, and how confidently different teams can act on the output.
Traditional foundations
Traditional forecasting is built on structured historical analysis. It includes methods such as:
Trend analysis (what direction are we moving, and how fast?)
Seasonality modeling (what repeats, when, and at what magnitude?)
Regression models (how do drivers like price, promo depth, and traffic relate to outcomes?)
Baseline modeling (what happens without a promo or major change, so lift can be isolated?)
These approaches are still useful because they force discipline. They make you define baselines and drivers rather than relying on intuition. They also tend to be easier to communicate across teams, which matters when finance, merchandising, and marketing need to trust the same number.
Traditional methods struggle when the business changes shape: new channels, new fulfillment options, major assortment shifts, or a step-change in media costs. In those moments, the model can be “accurate in the past” and quietly wrong in the present.
To keep traditional models practical, add a short assumptions sheet next to the forecast. It should state:
What period defines the baseline (and why that period is representative)
How promotions are normalized (and how you treat unusually deep discounts)
How stockouts and availability constraints are handled (ignored, imputed, or modeled explicitly)
Which external factors are included (holiday shifts, weather events, competitor pricing) and which are not
The time horizon the model is reliable for, plus what “reliable” means (error tolerance, confidence bands, bias)
That assumptions sheet reduces the most common forecasting failure: different teams arguing over the number when they’re actually disagreeing on the inputs.
Predictive AI modeling
Predictive AI forecasting uses machine learning to generate forward-looking estimates based on patterns in large, multi-source datasets. It can capture non-linear relationships and interactions that are hard to model manually, especially when drivers move together (for example, promo depth changes conversion, which changes inventory position, which changes delivery experience, which changes conversion again).
In plain terms, predictive AI helps when:
There are many interacting drivers (price, promos, media, weather, competitor activity)
The business changes quickly (new channels, new customer mix, new assortment)
You need frequent updates (weekly or daily forecasting cycles)
The key is positioning predictive AI as decision support, not expecting it to produce a single definitive answer.
The best implementations keep humans responsible for the questions and constraints:
What decisions are we supporting?
What risks are unacceptable?
Which metrics define success (margin, availability, CAC, repeat rate)?
What constraints matter (inventory, fulfillment capacity, brand rules)?
Two execution details make or break AI forecasting in practice:
Backtesting that matches reality. You test models on historical periods that include promotions, holidays, and channel shifts, not just “clean” weeks.
Monitoring for drift. The model needs simple alerts when performance changes (rising costs, falling conversion, new promo patterns) so you don’t keep trusting a forecast built for yesterday’s conditions.
💡 If you’re building this inside a marketing organization, it often lives alongside an advertising intelligence layer that unifies performance signals across platforms and turns them into decisions you can defend.
⚡ Models won't do your thinking for you. What they will do is expose whether any real thinking happened in the first place.
Unified cross-channel forecasting
Unified cross-channel forecasting is where retail forecasting becomes most strategic. Instead of predicting sales in isolation, it links demand creation across channels to business outcomes, so you can plan growth without double-counting impact or relying on last-click logic.
That means combining:
Retail media signals (on-site and off-site)
Programmatic display/video, including CTV
Paid social and search
Owned channels (email/SMS/app)
Commerce outcomes (sales, returns, margin)
A single model that explains everything sounds appealing but misses the mark. Business-aligned projections built on ranges, not false certainty, give leaders something far more useful: a clear basis for deciding where to invest and what to expect.
A unified forecast is usually built on three practical moves:
Standardize outcome definitions. Decide what counts as a conversion, how returns affect revenue, and how you treat in-store versus online outcomes.
Calibrate channel impact. Use experiments, lift studies, or controlled comparisons where possible so channels aren’t judged purely on attribution artifacts.
Run scenario curves, not single points. Estimate “if spend changes by X, outcomes move by Y” and show confidence bands so leaders can see both upside and risk.
A practical unified forecast answers questions like:
If we shift 15% of budget into retail media for six weeks, what is the expected sales lift range?
What happens to CAC and repeat rate if we reduce discount intensity but increase targeting quality?
How much of a seasonal spike can we support given current inventory and fulfillment constraints?
How to build a practical retail forecast
A practical retail forecast is a workflow, not a spreadsheet. It’s the process your team can run repeatedly without heroics.
The steps below are designed to be executed by teams with a medium level of technical depth—strong analysts, solid channel operators, but not necessarily a research lab.
Before the steps, one important framing: the goal is not to predict perfectly. The goal is to reduce bad surprises and make decisions earlier, with better inputs.
Align goals, data, and teams
The first step is to align on what the forecast is for. Different goals produce different forecasts.
Start by making three things explicit:
Which decisions the forecast will support (inventory buys, promo timing, budget allocation, expansion targets)
Which constraints cannot be violated (service level, margin floors, brand rules, capacity limits)
Now map the data you need. Keep it simple at first:
Sales and product data (by channel and category)
Pricing and promotions (calendar + depth)
Media delivery and performance (spend, impressions, clicks, conversions, cost)
Customer signals (new vs returning, loyalty tiers, repeat cadence)
After you map the data, you need owners. Forecasting fails quietly when no one owns the inputs.
To make ownership clear, here’s a short checklist you can assign:
Commerce analytics owns revenue and conversion definitions
Merchandising owns pricing and promo inputs
Marketing owns media and creative inputs
Finance owns planning horizons and scenario requirements
Ops owns availability constraints and fulfillment capacity
That ownership model actually speeds things up by eliminating the recurring argument over which "truth" to use.
Model scenarios across channels
Once alignment exists, you build scenarios. Scenario modeling is where forecasting becomes useful for leadership decisions.
At minimum, build three scenarios:
Baseline scenario: what happens if you keep today’s strategy
Growth scenario: what happens if you add investment (and where)
Constraint scenario: what happens if costs rise or inventory tightens
{{26-Retail-Demand-Forecasting-5="/tables"}}
Before you list scenarios, include a short statement of what will change between them. Then keep the differences controlled—otherwise you won’t know what caused the outcome change.
Here’s a practical way to define scenario levers. Use only what you can actually influence:
Budget by channel (including retail media and programmatic)
Promo calendar changes (timing + depth)
Pricing adjustments (category-level if needed)
Inventory availability assumptions (best case / expected / constrained)
Audience strategy changes (prospecting vs retention balance)
💡 Once scenarios are defined, you compare them using a consistent scorecard. A performance marketing framework is useful here, because it gives you a shared language for how spend turns into outcomes.
After you compare scenarios, summarize them in plain English. Leaders need the implication, not the model detail:
“This plan grows revenue, but margin is exposed if CAC rises.”
“This plan protects margin, but inventory risk increases.”
“This plan requires availability we do not have.”
Continuously optimize with real-time signals
A forecast becomes fragile when it’s updated too slowly. The solution isn’t to rebuild everything daily. It’s to define which signals should trigger an update.
Start with a weekly cadence for most retailers, then tighten where volatility is high (peak seasons, major promos, high-spend periods).
Signals that should trigger forecast updates include:
Media cost changes (CPM/CPC shifts, auction pressure)
Assortment shifts (new product, discontinued SKUs, vendor delays)
{{26-Retail-Demand-Forecasting-6="/tables"}}
Before you implement this, add a short “what we changed” note each update cycle. Forecast drift is easier to manage when you can trace why the forecast moved.
Turning forecasting into predictable growth
Forecasting becomes a growth engine when it is tied to execution loops. That means you forecast, act, measure, learn, and update—without waiting for quarterly resets.
A practical “forecast-to-growth” loop has three layers:
Learning layer: measurement, incrementality where possible, model updates
To put it differently, forecasting becomes “predictable growth” when:
the forecast is tied to real levers,
updates happen at the speed the business changes,
and results are fed back into future scenarios.
💡 If your forecasting work is detached from your media operating model, it will stay theoretical. That’s why it’s useful to align forecasting with modern media planning and buying practices—channel orchestration, pacing, and measurement discipline.
When businesses should upgrade their forecasting approach
Most retailers don’t need a full rebuild on day one. They do need to recognize when the current approach is no longer safe.
You should consider upgrading your forecasting approach when you see signals like these:
Multi-channel complexity increases: more channels, more data, more interactions, less clarity.
CPAs rise without clear explanation: performance changes faster than your planning cycle.
Retail media becomes material: RMNs move from “test” to “core budget line.”
CTV and video enter the mix: upper-funnel investment needs stronger scenario logic.
Teams argue over numbers, not decisions: forecasting has become a political artifact rather than a planning tool.
The simplest diagnostic is this question: Do you trust your forecast enough to commit inventory and budget at the same time? If the answer is no, your forecast is not integrated enough yet.
Conclusion: From forecasting in retail to growth strategy
Retail forecasting earns its place when it connects demand signals, marketing performance, and revenue planning inside one decision loop. The payoff is fewer blind spots when commitments are on the line—something no reporting upgrade can deliver on its own.
One principle worth carrying forward from this guide: stop chasing the perfect forecast and start building one that sharpens decisions. Ground it in clear drivers, model scenarios around the levers you actually control, and update it the moment the landscape shifts.
If you'd like to pressure-test your current forecasting approach—from inputs and scenarios to how media and retail signals connect—AI Digital's team can help you design a model that's practical, measurable, and built around growth decisions.
Blind spot
Key issues
Business impact
AI Digital solution
Lack of transparency in AI models
• Platforms own AI models and train on proprietary data • Brands have little visibility into decision-making • "Walled gardens" restrict data access
• Inefficient ad spend • Limited strategic control • Eroded consumer trust • Potential budget mismanagement
Open Garden framework providing: • Complete transparency • DSP-agnostic execution • Cross-platform data & insights
Optimizing ads vs. optimizing impact
• AI excels at short-term metrics but may struggle with brand building • Consumers can detect AI-generated content • Efficiency might come at cost of authenticity
• Short-term gains at expense of brand health • Potential loss of authentic connection • Reduced effectiveness in storytelling
Smart Supply offering: • Human oversight of AI recommendations • Custom KPI alignment beyond clicks • Brand-safe inventory verification
The illusion of personalization
• Segment optimization rebranded as personalization • First-party data infrastructure challenges • Personalization vs. surveillance concerns
• Potential mismatch between promise and reality • Privacy concerns affecting consumer trust • Cost barriers for smaller businesses
Elevate platform features: • Real-time AI + human intelligence • First-party data activation • Ethical personalization strategies
AI-Driven efficiency vs. decision-making
• AI shifting from tool to decision-maker • Black box optimization like Google Performance Max • Human oversight limitations
• Strategic control loss • Difficulty questioning AI outputs • Inability to measure granular impact • Potential brand damage from mistakes
Managed Service with: • Human strategists overseeing AI • Custom KPI optimization • Complete campaign transparency
Fig. 1. Summary of AI blind spots in advertising
Dimension
Walled garden advantage
Walled garden limitation
Strategic impact
Audience access
Massive, engaged user bases
Limited visibility beyond platform
Reach without understanding
Data control
Sophisticated targeting tools
Data remains siloed within platform
Fragmented customer view
Measurement
Detailed in-platform metrics
Inconsistent cross-platform standards
Difficult performance comparison
Intelligence
Platform-specific insights
Limited data portability
Restricted strategic learning
Optimization
Powerful automated tools
Black-box algorithms
Reduced marketer control
Fig. 2. Strategic trade-offs in walled garden advertising.
Core issue
Platform priority
Walled garden limitation
Real-world example
Attribution opacity
Claiming maximum credit for conversions
Limited visibility into true conversion paths
Meta and TikTok's conflicting attribution models after iOS privacy updates
Data restrictions
Maintaining proprietary data control
Inability to combine platform data with other sources
Amazon DSP's limitations on detailed performance data exports
Cross-channel blindspots
Keeping advertisers within ecosystem
Fragmented view of customer journey
YouTube/DV360 campaigns lacking integration with non-Google platforms
Black box algorithms
Optimizing for platform revenue
Reduced control over campaign execution
Self-serve platforms using opaque ML models with little advertiser input
Performance reporting
Presenting platform in best light
Discrepancies between platform-reported and independently measured results
Consistently higher performance metrics in platform reports vs. third-party measurement
Fig. 1. The Walled garden misalignment: Platform interests vs. advertiser needs.
Key dimension
Challenge
Strategic imperative
ROAS volatility
Softer returns across digital channels
Shift from soft KPIs to measurable revenue impact
Media planning
Static plans no longer effective
Develop agile, modular approaches adaptable to changing conditions
Brand/performance
Traditional division dissolving
Create full-funnel strategies balancing long-term equity with short-term conversion
Capability
Key features
Benefits
Performance data
Elevate forecasting tool
• Vertical-specific insights • Historical data from past economic turbulence • "Cascade planning" functionality • Real-time adaptation
• Provides agility to adjust campaign strategy based on performance • Shows which media channels work best to drive efficient and effective performance • Confident budget reallocation • Reduces reaction time to market shifts
• Dataset from 10,000+ campaigns • Cuts response time from weeks to minutes
• Reaches people most likely to buy • Avoids wasted impressions and budgets on poor-performing placements • Context-aligned messaging
• 25+ billion bid requests analyzed daily • 18% improvement in working media efficiency • 26% increase in engagement during recessions
Full-funnel accountability
• Links awareness campaigns to lower funnel outcomes • Tests if ads actually drive new business • Measures brand perception changes • "Ask Elevate" AI Chat Assistant
• Upper-funnel to outcome connection • Sentiment shift tracking • Personalized messaging • Helps balance immediate sales vs. long-term brand building
• Natural language data queries • True business impact measurement
Open Garden approach
• Cross-platform and channel planning • Not locked into specific platforms • Unified cross-platform reach • Shows exactly where money is spent
• Reduces complexity across channels • Performance-based ad placement • Rapid budget reallocation • Eliminates platform-specific commitments and provides platform-based optimization and agility
• Coverage across all inventory sources • Provides full visibility into spending • Avoids the inability to pivot across platform as you’re not in a singular platform
Fig. 1. How AI Digital helps during economic uncertainty.
Trend
What it means for marketers
Supply & demand lines are blurring
Platforms from Google (P-Max) to Microsoft are merging optimization and inventory in one opaque box. Expect more bundled “best available” media where the algorithm, not the trader, decides channel and publisher mix.
Walled gardens get taller
Microsoft’s O&O set now spans Bing, Xbox, Outlook, Edge and LinkedIn, which just launched revenue-sharing video programs to lure creators and ad dollars. (Business Insider)
Retail & commerce media shape strategy
Microsoft’s Curate lets retailers and data owners package first-party segments, an echo of Amazon’s and Walmart’s approaches. Agencies must master seller-defined audiences as well as buyer-side tactics.
AI oversight becomes critical
Closed AI bidding means fewer levers for traders. Independent verification, incrementality testing and commercial guardrails rise in importance.
Fig. 1. Platform trends and their implications.
Metric
Connected TV (CTV)
Linear TV
Video Completion Rate
94.5%
70%
Purchase Rate After Ad
23%
12%
Ad Attention Rate
57% (prefer CTV ads)
54.5%
Viewer Reach (U.S.)
85% of households
228 million viewers
Retail Media Trends 2025
Access Complete consumer behaviour analyses and competitor benchmarks.
Identify and categorize audience groups based on behaviors, preferences, and characteristics
Michaels Stores: Implemented a genAI platform that increased email personalization from 20% to 95%, leading to a 41% boost in SMS click through rates and a 25% increase in engagement.
Estée Lauder: Partnered with Google Cloud to leverage genAI technologies for real-time consumer feedback monitoring and analyzing consumer sentiment across various channels.
High
Medium
Automated ad campaigns
Automate ad creation, placement, and optimization across various platforms
Showmax: Partnered with AI firms toautomate ad creation and testing, reducing production time by 70% while streamlining their quality assurance process.
Headway: Employed AI tools for ad creation and optimization, boosting performance by 40% and reaching 3.3 billion impressions while incorporating AI-generated content in 20% of their paid campaigns.
High
High
Brand sentiment tracking
Monitor and analyze public opinion about a brand across multiple channels in real time
L’Oréal: Analyzed millions of online comments, images, and videos to identify potential product innovation opportunities, effectively tracking brand sentiment and consumer trends.
Kellogg Company: Used AI to scan trending recipes featuring cereal, leveraging this data to launch targeted social campaigns that capitalize on positive brand sentiment and culinary trends.
High
Low
Campaign strategy optimization
Analyze data to predict optimal campaign approaches, channels, and timing
DoorDash: Leveraged Google’s AI-powered Demand Gen tool, which boosted its conversion rate by 15 times and improved cost per action efficiency by 50% compared with previous campaigns.
Kitsch: Employed Meta’s Advantage+ shopping campaigns with AI-powered tools to optimize campaigns, identifying and delivering top-performing ads to high-value consumers.
High
High
Content strategy
Generate content ideas, predict performance, and optimize distribution strategies
JPMorgan Chase: Collaborated with Persado to develop LLMs for marketing copy, achieving up to 450% higher clickthrough rates compared with human-written ads in pilot tests.
Hotel Chocolat: Employed genAI for concept development and production of its Velvetiser TV ad, which earned the highest-ever System1 score for adomestic appliance commercial.
High
High
Personalization strategy development
Create tailored messaging and experiences for consumers at scale
Stitch Fix: Uses genAI to help stylists interpret customer feedback and provide product recommendations, effectively personalizing shopping experiences.
Instacart: Uses genAI to offer customers personalized recipes, mealplanning ideas, and shopping lists based on individual preferences and habits.
Medium
Medium
Share article
Url copied to clipboard
No items found.
Subscribe to our Newsletter
THANK YOU FOR YOUR SUBSCRIPTION
Oops! Something went wrong while submitting the form.
Questions? We have answers
How is retail forecasting different from reporting or planning?
Reporting summarizes what already happened, while planning sets assumptions about what you intend to do. Retail forecasting sits between them: it estimates what is likely to happen next based on historical performance and current signals, and it updates when inputs change. The most practical difference is timing—forecasting is meant to influence decisions before inventory and budget commitments are locked in.
Which data sources are most important for accurate retail forecasts?
The most important sources are the ones that explain demand drivers: sales and conversion data by channel, pricing and promotion history, inventory availability and fulfillment constraints, and media performance signals (spend, delivery, outcomes). Customer behavior signals—new vs returning mix, repeat cadence, loyalty tiers—become essential as soon as retention and profitability matter as much as acquisition volume.
How does AI improve retail forecasting accuracy?
AI improves forecasting when you have many interacting variables and you need updates frequently. Machine learning models can capture patterns that are hard to model manually—such as how promo depth interacts with channel mix and customer segment behavior—then refresh predictions as new data arrives. The win isn’t “AI vs non-AI.” The win is faster learning cycles, better handling of complex drivers, and a forecasting process that can keep up with how quickly retail conditions change.
What role does retail media play in forecasting performance?
Retail media changes forecasting because it brings shopper signals and conversion outcomes closer to the point of purchase, which can tighten feedback loops. It also changes budgeting behavior because outcomes can be seen and optimized quickly, encouraging more frequent scenario updates and pacing adjustments. To forecast effectively in a retail media-heavy mix, you need consistent definitions across networks, an understanding of how auctions and inventory affect delivery, and a clear view of what outcomes are incremental versus simply captured.
How often should businesses update their retail forecasts?
Weekly is a strong default for most retailers, with more frequent updates during peak seasons, major promotions, or high-spend periods. The best cadence is signal-driven: update when meaningful drivers change, such as media costs, conversion rates, inventory availability, or competitive pricing pressure. A forecast that updates too slowly becomes decorative; a forecast that updates constantly without governance becomes noise.
What are the most common retail forecasting mistakes to avoid?
The most common mistakes are treating forecasting as a single number instead of a set of scenarios, ignoring inventory and fulfillment constraints, and assuming media performance will stay stable when auction dynamics change. Teams also overfit on short-term accuracy while missing the point of the forecast: improving decisions. Finally, many organizations fail to define ownership of inputs, which leads to “multiple versions of truth” and forecasts that no one trusts enough to act on.
How do retail demand forecasting and retail demand planning work together?
Retail demand forecasting estimates what customers are likely to buy across a given time period, using historical sales plus signals like pricing, promotions, media performance, and availability constraints. Retail demand planning takes that forecast and turns it into operational decisions—how much inventory to order, where to allocate it, when to replenish, and how to align merchandising and marketing so the business can actually meet projected demand without overstocking. In practice, forecasting sets the expected demand curve, while planning translates it into commitments and guardrails, then feeds real-world results back into the next forecast cycle.
Have other questions?
If you have more questions, contact us so we can help.


.webp)
.svg)
.svg)