Digital Advertising Transparency: Why It Matters in a Fragmented Ecosystem
April 6, 2026
11
minutes read
Most advertisers cannot trace more than half of their programmatic budget from initial spend to publisher delivery, and the platforms they rely on for answers are often part of the problem. In this article, we break down where transparency fails across the digital advertising ecosystem, how it affects campaign economics and measurement, and what governance approaches are emerging to address it.
Digital advertising now accounts for more than 80% of total US media ad spend, with marketers directing an estimated $422 billion toward media investment in 2025 alone. That figure represents an extraordinary expansion of channels, platforms, and intermediaries—and with it, a growing disconnect between how much advertisers spend and how clearly they can see where that money goes.
Campaigns today run across search platforms, social networks, retail media environments, connected TV, programmatic marketplaces, and digital audio. Each of these channels introduces its own buying mechanisms, reporting dashboards, and optimization algorithms. The result is an ecosystem that offers enormous reach but provides only partial visibility into how digital advertising transparency affects day-to-day media operations.
Many media buyers rely on platform-generated reports and agency summaries that aggregate performance data without exposing the underlying cost structures, fee distributions, or measurement methodologies. When an advertiser launches a cross-channel campaign, they may see topline metrics—impressions served, clicks recorded, conversions attributed—without understanding how those numbers were calculated or how much of the budget actually reached a working media environment.
Transparency in advertising has become one of the most pressing concerns in the industry not because the concept is new, but because the infrastructure surrounding it has grown more layered and less legible. As campaigns span more environments, the distance between an advertiser's budget and the audience it is meant to reach has widened.
This article explores what digital advertising transparency means in practice, where and why it breaks down across the modern ecosystem, and what structural changes are needed to restore meaningful visibility into campaign execution and performance.
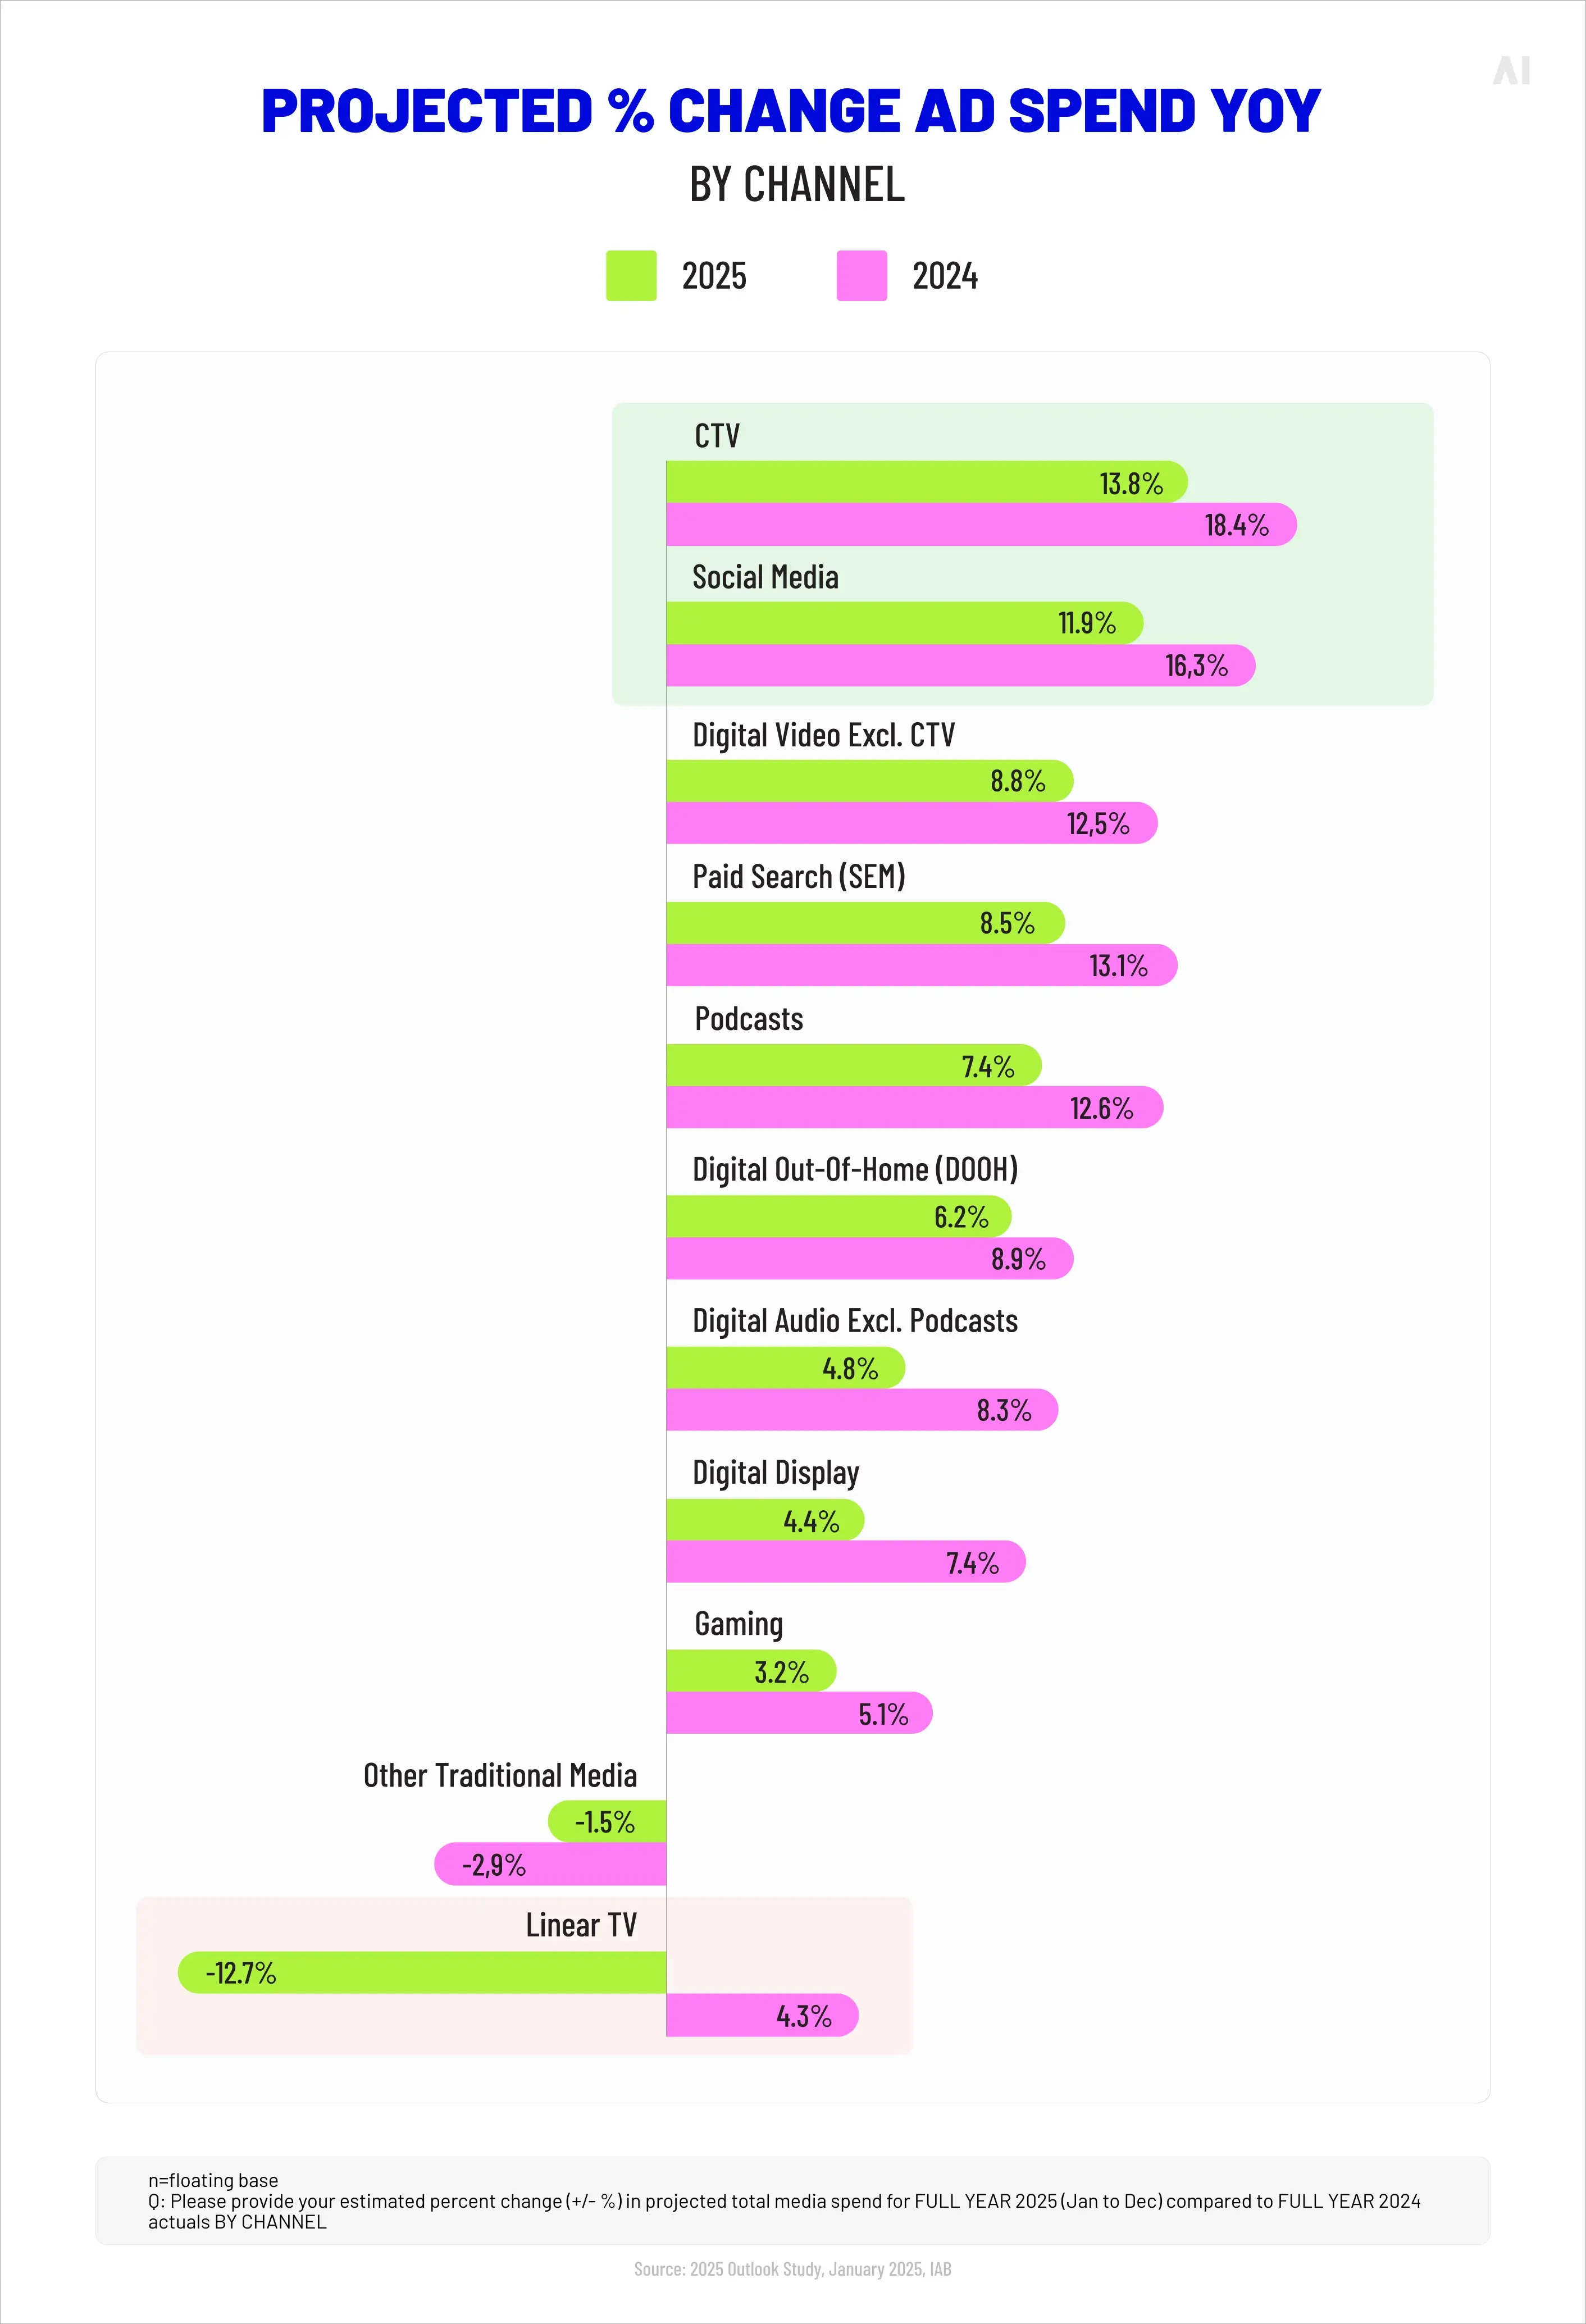
Projected % change in ad spend by channel (Source)
What is transparency in digital advertising?
Digital advertising transparency refers to the ability of advertisers to clearly understand how their campaigns are executed, measured, and priced across every stage of the media supply chain.
In practical terms, this means having visibility into how media inventory is sourced and purchased, which intermediaries participate in each transaction, how costs are distributed among those intermediaries, and how performance metrics—from impressions to conversions—are calculated and reported.
Transparency is not a single metric or a compliance checkbox. It is an operating principle that touches every part of a campaign's lifecycle. When it works, advertisers can evaluate whether their media investments are efficient, whether reported outcomes reflect genuine audience engagement, and whether the platforms and partners they work with are aligned with their marketing objectives. When it does not, budgets leak through opaque supply paths, reporting becomes unreliable, and strategic decision-making suffers.
Programmatic is evolving from an opaque system into one defined by accountability and control. — Bob Liodice, CEO, Association of National Advertisers (ANA)
And the volume of data has never been the problem. Advertisers have access to more reporting than ever. Transparent advertising earns its value by addressing a harder question: is the data accurate, independently verifiable, and detailed enough to guide informed decisions about where and how spend is allocated?
Where transparency breaks down in the advertising ecosystem
Despite significant technological advancement in how campaigns are planned, bought, and measured, visibility remains limited at several critical points. These breakdowns are not always the result of deliberate obfuscation—they are often structural consequences of how the advertising ecosystem has evolved.
Walled garden environments
The most widely discussed transparency challenge in digital advertising involves the closed platforms that dominate media spend. Google, Meta, and Amazon collectively generated approximately $524.4 billion in advertising revenue in 2025. By 2027, walled gardens are projected to control 83% of global digital ad revenue.
Use of online platforms among US adults, showing heavy concentration areas around a few platforms (Source).
These platforms control inventory, audience data, attribution models, and reporting dashboards within their own environments. Advertisers buying through Google's DV360, Meta Business Manager, or Amazon DSP are working with proprietary measurement frameworks that cannot be independently verified at a granular level. Cross-platform comparison becomes difficult when each environment defines metrics differently and restricts data export.
The scale of these platforms makes them indispensable for most advertisers, but their closed architecture limits the ability to audit performance or validate that reported outcomes align with actual business results.
Programmatic advertising now accounts for more than 90% of all digital display ad buying in the US. The automation that enables this scale also introduces layers of intermediaries—demand-side platforms, supply-side platforms, ad exchanges, verification vendors, and data providers—each of which applies fees that may not be fully visible to the advertiser.
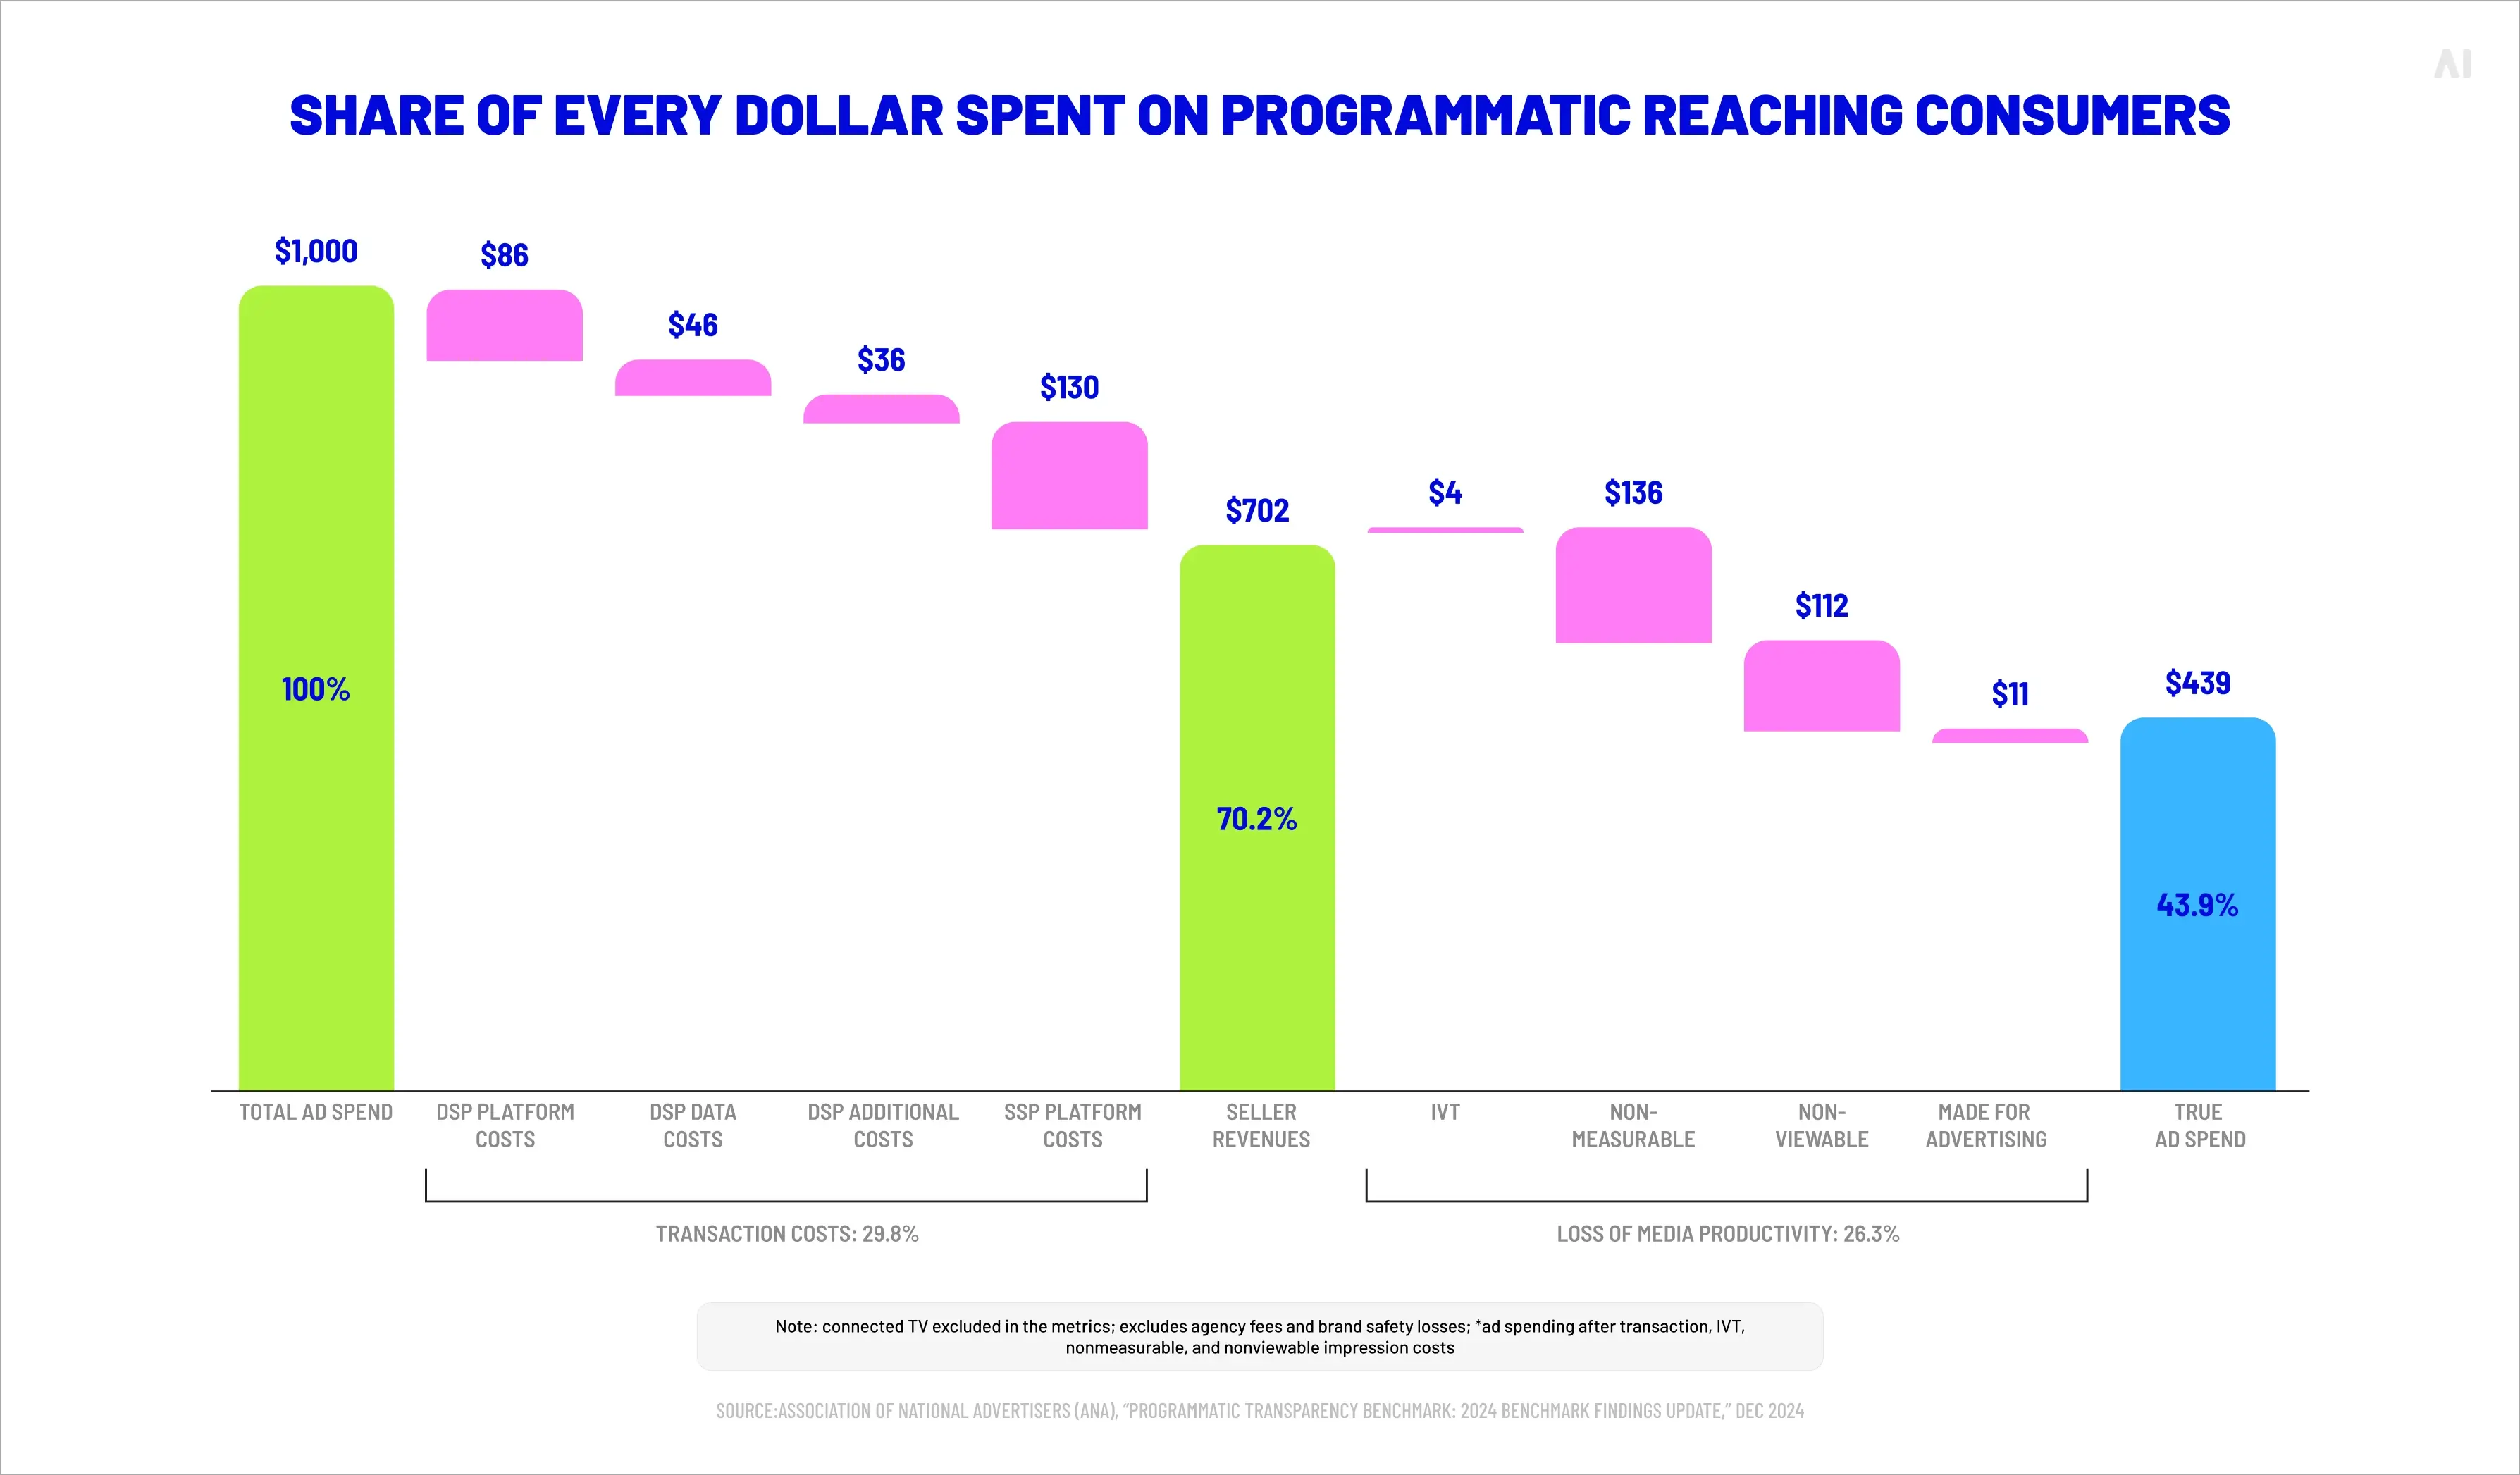
Share of every dollar spent on programmatic reaching consumers (Source)
The landmark ISBA/PwC study found that only 51% of advertiser spend reached publishers, with 15% classified as an unexplained "unknown delta." While subsequent industry efforts have narrowed that gap—the ANA's Q3 2025 benchmark showed working media share climbing to 47.1%—the supply chain remains a significant source of cost leakage. Each intermediary adds a layer of abstraction between advertiser intent and media delivery, and not all of those layers contribute proportional value.
Every advertising platform maintains its own data environment. Google stores performance data within its ecosystem. Meta reports through its own dashboards. Amazon restricts detailed performance exports. Retail media networks each maintain separate analytics environments.
For advertisers running campaigns across multiple channels, this siloed architecture makes it difficult—and in some cases impossible—to unify audience insights, deduplicate reach, or compare performance on consistent terms. A conversion recorded in Meta may also be claimed by Google, and neither platform provides the cross-referencing needed to resolve the discrepancy.
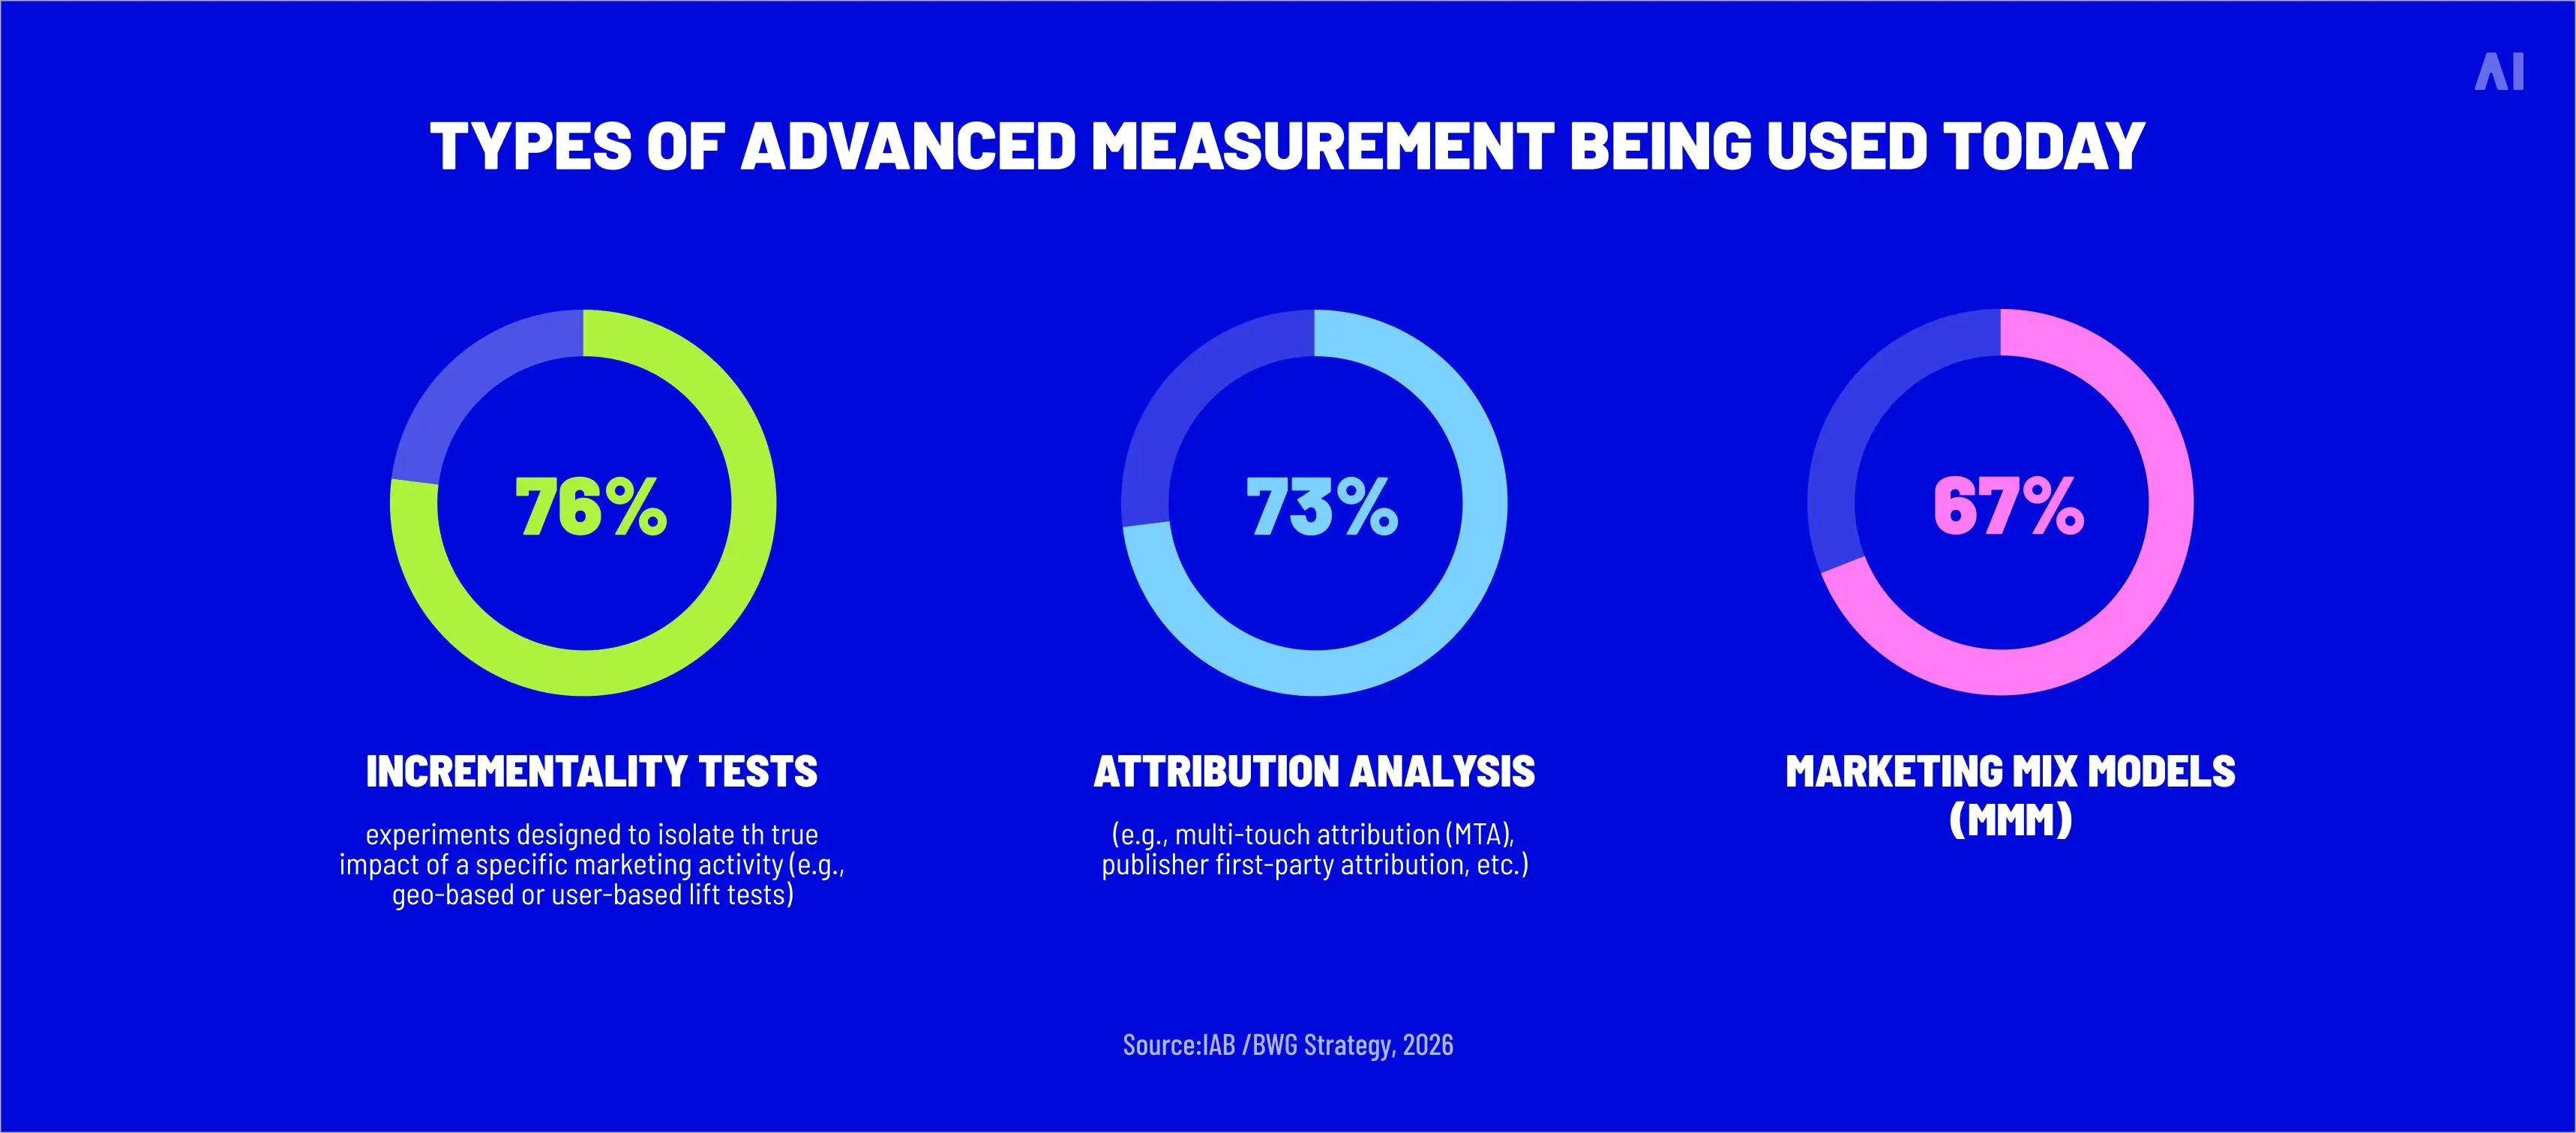
The IAB's December 2024 survey found that 64% of US ad buyers planned to focus significantly more resources on cross-platform measurement in 2025—a clear signal that the industry recognizes the problem even if it has yet to solve it.
Types of advanced measurement being used today (Source)
Hidden costs in programmatic advertising
One of the most persistent transparency in advertising challenges involves the economics of programmatic media buying. The automation that makes programmatic efficient also creates an environment where multiple intermediaries apply fees at various stages of a transaction, and those fees are not always disclosed to the advertiser.
Intermediary take rates
Technology providers within the programmatic supply chain charge service fees, platform access fees, or take a percentage of media spend as it passes through their systems. DSPs typically charge fees on the buy side; SSPs charge on the sell side. Verification, brand safety, and data providers add further costs.
The Adalytics study on supply chain fees found that even when controlling for media buyer, supply path, and publisher domain, intermediary revenue share could vary by up to 80% on individual impressions—ranging from a 5% fee on one impression to an 85% fee on another through the same supply path. This level of variability makes it nearly impossible for advertisers to predict or benchmark what they are actually paying for media delivery.
Auction dynamics and pricing opacity
Programmatic transactions take place through real-time auctions, but the mechanics of those auctions are not always visible to buyers. First-price auctions, second-price auctions, and hybrid models coexist across exchanges. Bid shading algorithms applied by DSPs adjust bids based on proprietary logic. Floor prices set by SSPs may fluctuate without notice.
The advertiser sees a final clearing price but may not understand how that price was reached, which competing bids were in the auction, or whether the supply path selected by the DSP was the most cost-efficient available. As our previous analysis noted, a DSP's preferential agreement with a specific SSP can route bids through higher-cost paths, resulting in the advertiser unknowingly overpaying for the same inventory.
Opaque reporting structures
Reporting systems often aggregate or simplify performance data in ways that obscure detailed cost structures. An advertiser may see total spend and total impressions but not the breakdown of how much was absorbed by technology fees, data costs, or non-viewable placements.
The ANA's Q2 2025 benchmark estimated that $26.8 billion in global media value is still lost annually to programmatic inefficiencies. Improving supply path efficiency—reducing the number of intermediaries, consolidating SSP partnerships, and demanding log-level data—has become a top priority for advertisers seeking to reclaim lost budget.
80% of the buyers we're working with on SPO are now past negotiating deals primarily on cost—it's now more about supply chain integrity. — Kyle Dozeman, CRO Americas, PubMatic (Digiday)
Advertising transparency is closely connected to the degree of control advertisers have over campaign execution and the performance outcomes they can independently verify. These three concepts—transparency, control, and performance—exist in tension, and advertisers frequently face trade-offs between them.
Highly automated advertising environments can improve operational efficiency. Platform-managed campaigns on Google Performance Max or Meta Advantage+ reduce the manual workload for media buyers and often deliver strong reported results. But that efficiency comes at a cost: reduced visibility into which creative assets are being shown, which audiences are being reached, and how bidding decisions are made.
An advertiser using a fully automated campaign type may see strong conversion numbers in the platform dashboard but have limited ability to verify whether those conversions are incremental, whether the audience mix aligns with their strategy, or whether the cost-per-acquisition reflects genuine efficiency gains or simply the platform's attribution methodology.
The trade-off is not always binary. Some advertisers accept reduced transparency in exchange for convenience and scale. Others insist on maintaining manual control and independent verification, even when it requires more resources. The challenge is that the industry's current infrastructure often forces this choice—transparent advertising and automated efficiency are not yet fully compatible, particularly within walled garden environments where the platform controls both the optimization logic and the measurement framework.
Measurement bias and attribution challenges
Measurement transparency represents another major area where visibility breaks down. Even when advertisers have reasonable clarity on costs and supply paths, understanding what their campaigns actually achieved remains difficult.
Platform-reported performance
Platforms measure conversions using their own attribution models, lookback windows, and reporting frameworks. Meta may attribute a conversion to an ad viewed within a 7-day window. Google may count it based on a click within 30 days. Each platform has a structural incentive to present favourable performance metrics, and advertisers who rely solely on platform-reported data may overestimate the effectiveness of individual channels.
This is not a theoretical concern. Research notes that Apple's iOS 14.5 update reduced Facebook's attribution visibility by up to 50% for some advertisers—a dramatic illustration of how platform-dependent measurement can be.
Attribution inconsistencies
Different attribution methodologies produce conflicting results. Last-click attribution credits the final touchpoint before conversion, ignoring earlier interactions that may have driven awareness or consideration. Multi-touch models attempt to distribute credit more evenly, but they require cross-platform data access that walled gardens rarely provide.
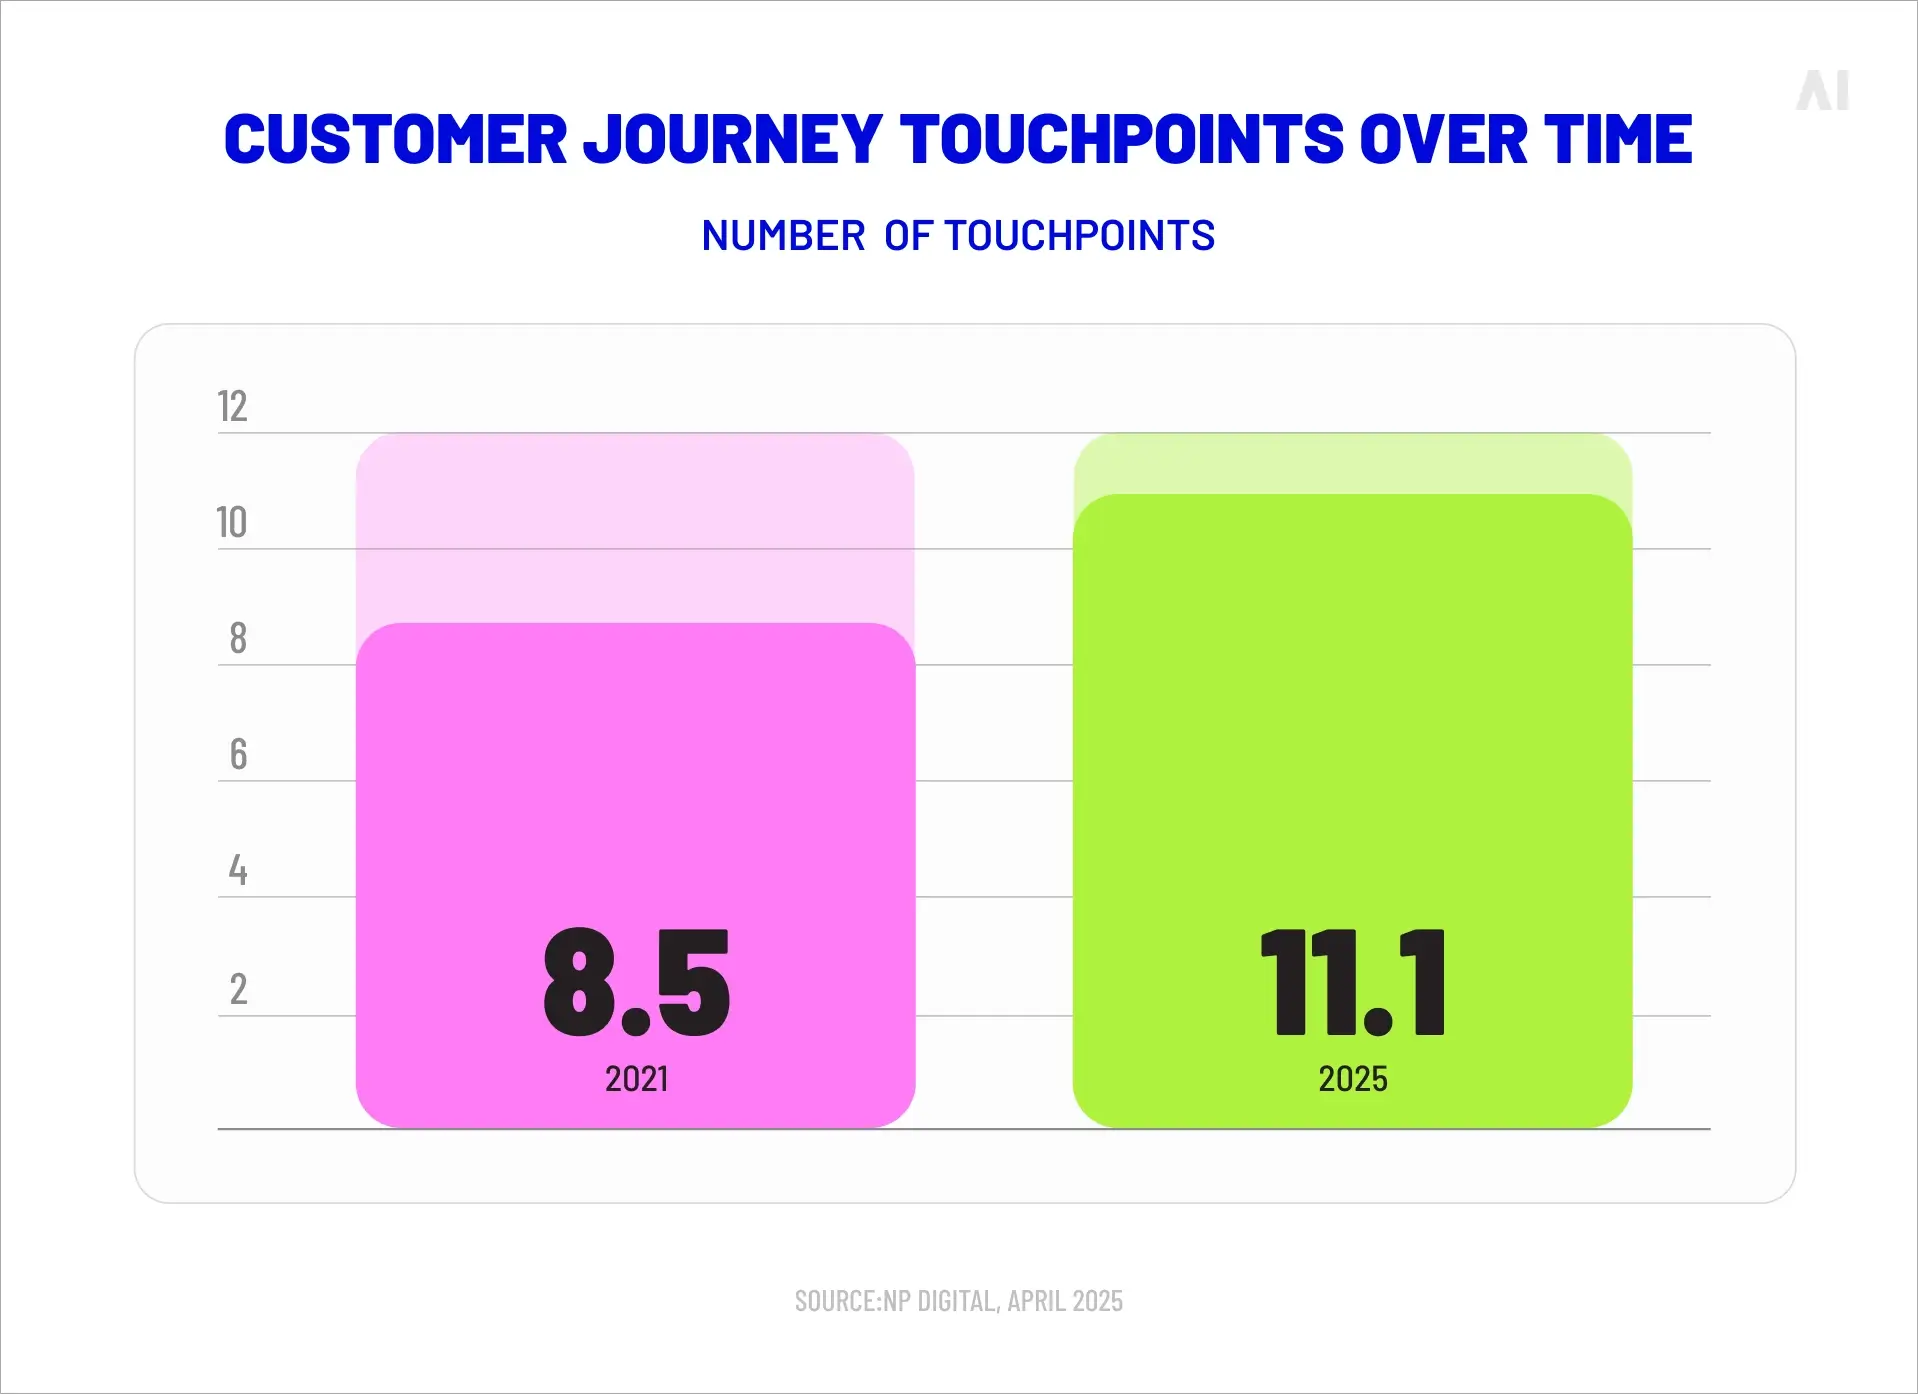
The result is a fragmented picture. An advertiser running campaigns across search, social, CTV, and display may find that each platform claims credit for the same conversions, with no mechanism to reconcile the overlap. Today's consumers interact with brands across an average of 11.1 touchpoints before converting, making accurate attribution both more important and more difficult.
Advertisers often struggle to understand how multiple channels contribute to a single conversion event. A consumer might see a CTV ad, engage with a social post, click a search result, and complete a purchase through a retail media environment—all within a single buying journey. No single platform captures this full path.
TheANA found that 55% of US advertisers cite lack of standardization across platforms as their biggest measurement challenge, particularly in emerging environments like retail media. Without consistent definitions of impressions, viewability, and conversion, cross-platform performance comparison remains more art than science.
Transparency and efficiency are now table stakes. What separates winners is disciplined execution. —Bob Liodice, CEO, ANA (ANA)
The advertising ecosystem is not consolidating. It is expanding. Each new channel and platform introduces its own data environment, measurement standards, and reporting infrastructure. This fragmentation is a primary driver of the transparency in marketing challenges that advertisers face today.
Consider the breadth of environments where advertising now runs:
Retail media networks—Amazon, Walmart, Instacart, Kroger, and others now operate as major advertising platforms, each with proprietary measurement systems.
Connected TV—CTV's share of programmatic spend jumped to 44% by Q2 2025, introducing premium inventory alongside significant measurement gaps. CTV measurability stood at just 64.1% in Q1 2025, well below display benchmarks.
Programmatic marketplaces—Open exchange, private marketplace, and programmatic guaranteed deals coexist, each with different transparency characteristics.
Social media platforms—TikTok, Instagram, YouTube, Snapchat, and LinkedIn maintain separate reporting systems with limited interoperability.
As advertisers expand into these environments, maintaining clear visibility into campaign performance becomes harder with each additional platform. Budget allocation decisions depend on accurate cross-channel comparison, but the infrastructure to support that comparison does not yet exist in a standardised form.
The industry is not short on data. The problem is that data is locked within separate systems that do not communicate with each other, making holistic performance assessment exceptionally difficult.
When transparency in advertising is limited, the consequences extend beyond operational inconvenience. They affect budgets, strategic decisions, and competitive positioning.
Inefficient media spending
Without clear visibility into supply paths and intermediary fees, advertisers cannot reliably identify wasted budget. The ANA's Q4 2025 benchmark found a significant performance gap between advertisers who actively manage quality governance and those who do not—quality-led advertisers converted 56.7% of programmatic spend into benchmark-qualified impressions, compared to just 37.5% among lower performers. That gap represents real budget flowing toward non-viewable, fraudulent, or low-quality placements.
Misinterpreted performance data
Inconsistent reporting frameworks lead advertisers to draw incorrect conclusions about campaign effectiveness. When platforms use different attribution windows, conversion definitions, and reporting methodologies, the same campaign can appear highly effective on one dashboard and underperforming on another. Decisions made on this data—scaling spend, cutting channels, shifting creative strategy—may be based on a distorted picture of reality.
Reduced strategic control
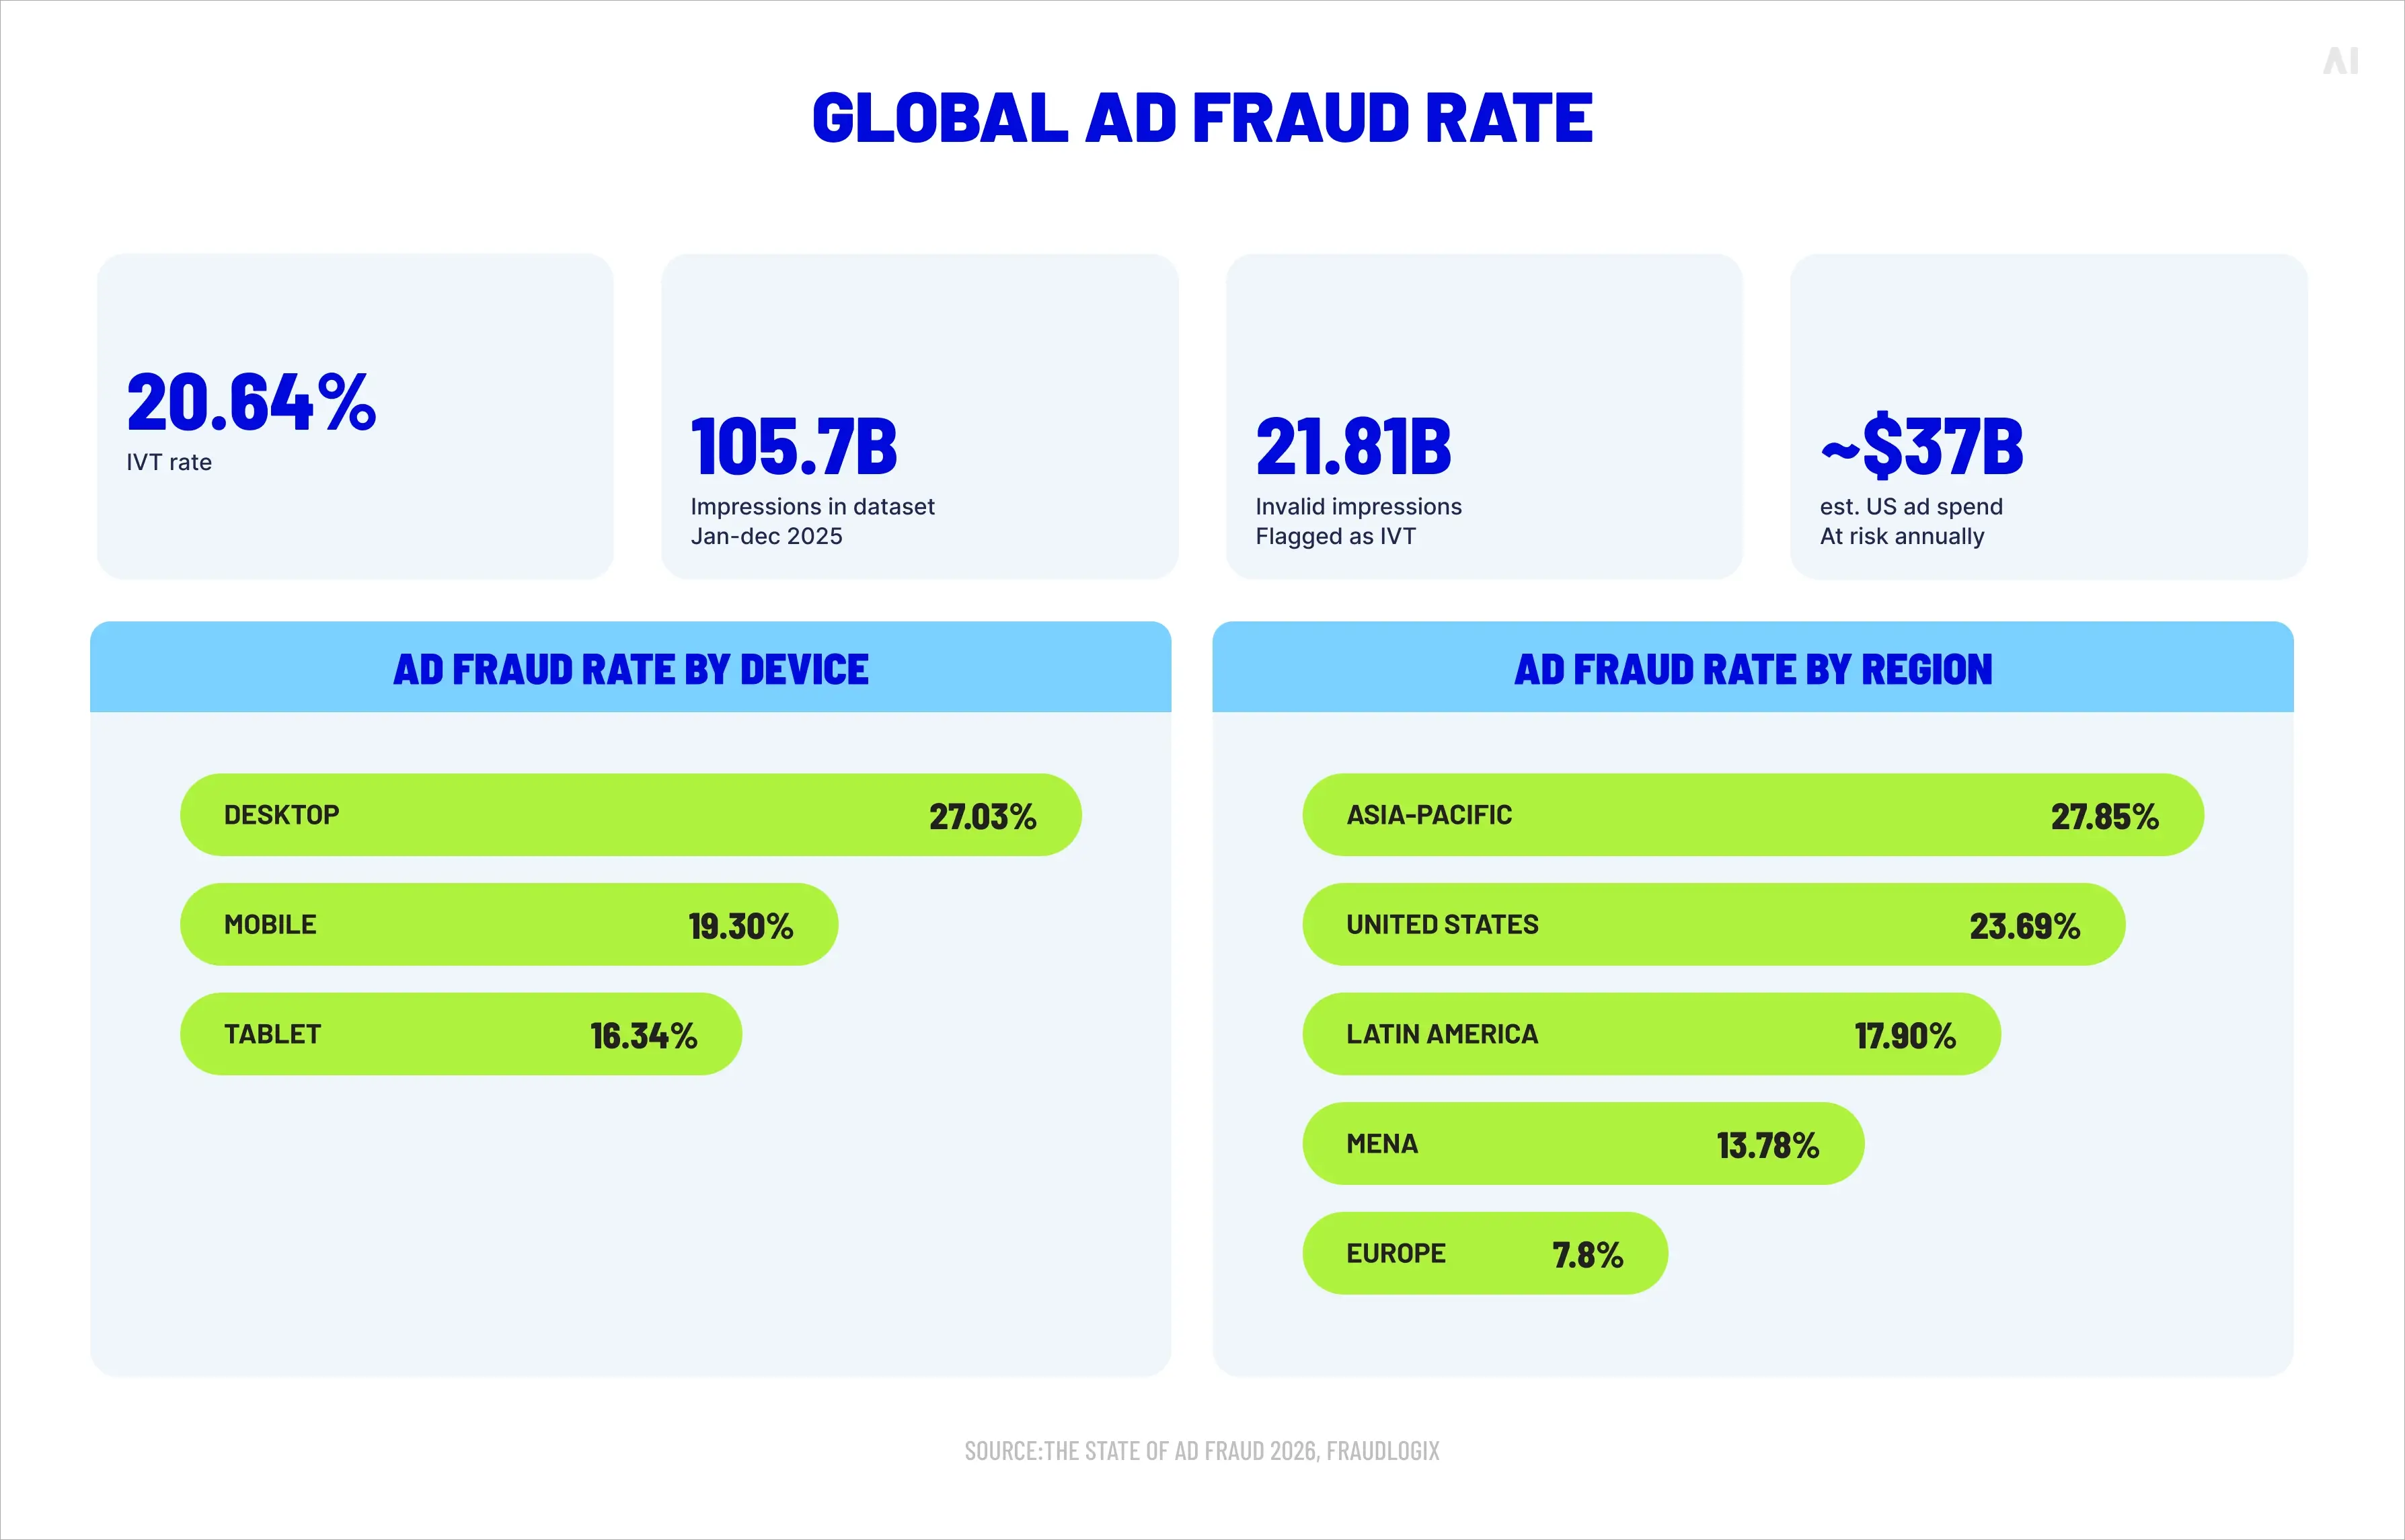
When transparency is limited, advertisers lose the ability to make fully informed decisions about their media strategy. They may not know which supply paths deliver the best value, which audiences are being reached across channels, or whether their creative messaging is appearing in brand-suitable environments. Fraudlogix's analysis of 105.7 billion impressions in 2025 found a global invalid traffic rate of 20.64%—meaning roughly one in five ad impressions showed characteristics of non-human or fraudulent activity.
These risks compound as advertising budgets increase and campaigns expand across more platforms. An advertiser spending $10 million across five channels faces a fundamentally different transparency challenge than one spending $1 million on a single platform. The scale magnifies every inefficiency and makes every blind spot more costly.
Improving digital advertising transparency is not only a matter of deploying better technology. It is an organisational and structural challenge that requires coordinated action across multiple layers of the advertising ecosystem.
Technology solutions—log-level data analysis, supply path optimization tools, independent verification services—are necessary but insufficient on their own. Without a governance framework that defines how measurement should work, how reporting should be standardised, and how accountability should be distributed, these tools operate in isolation.
Advertisers are increasingly exploring governance frameworks that serve several interconnected purposes:
Standardize performance evaluation across platforms, ensuring that metrics like viewability, attribution, and conversion are defined consistently.
Improve supply chain visibility by requiring log-level data sharing and reducing the number of intermediary hops between advertiser and publisher.
Align internal teams around shared measurement frameworks, so that media, analytics, and strategy functions are working from the same data.
Establish accountability structures that hold platforms, agencies, and technology partners to defined transparency standards.
"Advertisers that actively govern quality are converting more of their budgets into benchmark-qualified impressions—and seeing measurably stronger results."—ANA Q4 2025 Programmatic Transparency Benchmark (ANA)
The concept of governance may sound abstract, but its application is practical. It determines whether an advertiser has a unified view of campaign performance, whether supply chain partners are held to contractual transparency requirements, and whether media investment decisions are based on verified outcomes rather than platform-reported estimates.
Governance is the structural layer that makes transparency sustainable rather than episodic—not a quarterly audit, but a continuous operating standard.
Conclusion: Building visibility in modern advertising ecosystems
Transparency in advertising is no longer a niche concern for procurement teams or compliance officers. It has become a central strategic issue for any brand investing meaningfully in digital media.
The challenges are structural. Complex supply chains introduce hidden costs and reduce visibility into how budgets are distributed. Walled gardens restrict independent measurement and cross-platform data access. Fragmented measurement systems make unified performance evaluation difficult. And the expanding landscape of CTV, retail media, and programmatic marketplaces adds new layers of complexity with each passing quarter.
But the path forward is becoming clearer. Key principles for advertisers seeking greater transparency include:
Demand supply chain visibility. Require log-level data from DSP and SSP partners to understand where budgets are allocated and how fees are distributed.
Reduce reliance on platform-reported metrics. Invest in independent measurement and attribution solutions that provide cross-platform verification.
Consolidate supply paths. Work with fewer, higher-quality SSPs and prioritise direct publisher relationships where possible.
Standardize measurement frameworks. Ensure that internal teams and external partners are aligned on consistent definitions of key metrics.
Adopt governance structures. Move beyond ad hoc audits toward continuous transparency frameworks that coordinate measurement, reporting, and media operations across platforms.
These are not theoretical recommendations. They reflect the direction the industry is moving, as evidenced by the ANA's ongoing benchmark programme, the growth of supply path optimization practices, and the emergence of governance-oriented approaches to media management.
AI Digital works with advertisers to address these challenges through a DSP-agnostic, cross-platform approach that prioritises transparency, supply chain efficiency, and independent performance measurement. Our Open Garden framework and Smart Supply service are built specifically to give advertisers clearer visibility into their media investments. If you are looking to improve transparency across your programmatic operations, reach out to our team to discuss how we can help.
Blind spot
Key issues
Business impact
AI Digital solution
Lack of transparency in AI models
• Platforms own AI models and train on proprietary data • Brands have little visibility into decision-making • "Walled gardens" restrict data access
• Inefficient ad spend • Limited strategic control • Eroded consumer trust • Potential budget mismanagement
Open Garden framework providing: • Complete transparency • DSP-agnostic execution • Cross-platform data & insights
Optimizing ads vs. optimizing impact
• AI excels at short-term metrics but may struggle with brand building • Consumers can detect AI-generated content • Efficiency might come at cost of authenticity
• Short-term gains at expense of brand health • Potential loss of authentic connection • Reduced effectiveness in storytelling
Smart Supply offering: • Human oversight of AI recommendations • Custom KPI alignment beyond clicks • Brand-safe inventory verification
The illusion of personalization
• Segment optimization rebranded as personalization • First-party data infrastructure challenges • Personalization vs. surveillance concerns
• Potential mismatch between promise and reality • Privacy concerns affecting consumer trust • Cost barriers for smaller businesses
Elevate platform features: • Real-time AI + human intelligence • First-party data activation • Ethical personalization strategies
AI-Driven efficiency vs. decision-making
• AI shifting from tool to decision-maker • Black box optimization like Google Performance Max • Human oversight limitations
• Strategic control loss • Difficulty questioning AI outputs • Inability to measure granular impact • Potential brand damage from mistakes
Managed Service with: • Human strategists overseeing AI • Custom KPI optimization • Complete campaign transparency
Fig. 1. Summary of AI blind spots in advertising
Dimension
Walled garden advantage
Walled garden limitation
Strategic impact
Audience access
Massive, engaged user bases
Limited visibility beyond platform
Reach without understanding
Data control
Sophisticated targeting tools
Data remains siloed within platform
Fragmented customer view
Measurement
Detailed in-platform metrics
Inconsistent cross-platform standards
Difficult performance comparison
Intelligence
Platform-specific insights
Limited data portability
Restricted strategic learning
Optimization
Powerful automated tools
Black-box algorithms
Reduced marketer control
Fig. 2. Strategic trade-offs in walled garden advertising.
Core issue
Platform priority
Walled garden limitation
Real-world example
Attribution opacity
Claiming maximum credit for conversions
Limited visibility into true conversion paths
Meta and TikTok's conflicting attribution models after iOS privacy updates
Data restrictions
Maintaining proprietary data control
Inability to combine platform data with other sources
Amazon DSP's limitations on detailed performance data exports
Cross-channel blindspots
Keeping advertisers within ecosystem
Fragmented view of customer journey
YouTube/DV360 campaigns lacking integration with non-Google platforms
Black box algorithms
Optimizing for platform revenue
Reduced control over campaign execution
Self-serve platforms using opaque ML models with little advertiser input
Performance reporting
Presenting platform in best light
Discrepancies between platform-reported and independently measured results
Consistently higher performance metrics in platform reports vs. third-party measurement
Fig. 1. The Walled garden misalignment: Platform interests vs. advertiser needs.
Key dimension
Challenge
Strategic imperative
ROAS volatility
Softer returns across digital channels
Shift from soft KPIs to measurable revenue impact
Media planning
Static plans no longer effective
Develop agile, modular approaches adaptable to changing conditions
Brand/performance
Traditional division dissolving
Create full-funnel strategies balancing long-term equity with short-term conversion
Capability
Key features
Benefits
Performance data
Elevate forecasting tool
• Vertical-specific insights • Historical data from past economic turbulence • "Cascade planning" functionality • Real-time adaptation
• Provides agility to adjust campaign strategy based on performance • Shows which media channels work best to drive efficient and effective performance • Confident budget reallocation • Reduces reaction time to market shifts
• Dataset from 10,000+ campaigns • Cuts response time from weeks to minutes
• Reaches people most likely to buy • Avoids wasted impressions and budgets on poor-performing placements • Context-aligned messaging
• 25+ billion bid requests analyzed daily • 18% improvement in working media efficiency • 26% increase in engagement during recessions
Full-funnel accountability
• Links awareness campaigns to lower funnel outcomes • Tests if ads actually drive new business • Measures brand perception changes • "Ask Elevate" AI Chat Assistant
• Upper-funnel to outcome connection • Sentiment shift tracking • Personalized messaging • Helps balance immediate sales vs. long-term brand building
• Natural language data queries • True business impact measurement
Open Garden approach
• Cross-platform and channel planning • Not locked into specific platforms • Unified cross-platform reach • Shows exactly where money is spent
• Reduces complexity across channels • Performance-based ad placement • Rapid budget reallocation • Eliminates platform-specific commitments and provides platform-based optimization and agility
• Coverage across all inventory sources • Provides full visibility into spending • Avoids the inability to pivot across platform as you’re not in a singular platform
Fig. 1. How AI Digital helps during economic uncertainty.
Trend
What it means for marketers
Supply & demand lines are blurring
Platforms from Google (P-Max) to Microsoft are merging optimization and inventory in one opaque box. Expect more bundled “best available” media where the algorithm, not the trader, decides channel and publisher mix.
Walled gardens get taller
Microsoft’s O&O set now spans Bing, Xbox, Outlook, Edge and LinkedIn, which just launched revenue-sharing video programs to lure creators and ad dollars. (Business Insider)
Retail & commerce media shape strategy
Microsoft’s Curate lets retailers and data owners package first-party segments, an echo of Amazon’s and Walmart’s approaches. Agencies must master seller-defined audiences as well as buyer-side tactics.
AI oversight becomes critical
Closed AI bidding means fewer levers for traders. Independent verification, incrementality testing and commercial guardrails rise in importance.
Fig. 1. Platform trends and their implications.
Metric
Connected TV (CTV)
Linear TV
Video Completion Rate
94.5%
70%
Purchase Rate After Ad
23%
12%
Ad Attention Rate
57% (prefer CTV ads)
54.5%
Viewer Reach (U.S.)
85% of households
228 million viewers
Retail Media Trends 2025
Access Complete consumer behaviour analyses and competitor benchmarks.
Identify and categorize audience groups based on behaviors, preferences, and characteristics
Michaels Stores: Implemented a genAI platform that increased email personalization from 20% to 95%, leading to a 41% boost in SMS click through rates and a 25% increase in engagement.
Estée Lauder: Partnered with Google Cloud to leverage genAI technologies for real-time consumer feedback monitoring and analyzing consumer sentiment across various channels.
High
Medium
Automated ad campaigns
Automate ad creation, placement, and optimization across various platforms
Showmax: Partnered with AI firms toautomate ad creation and testing, reducing production time by 70% while streamlining their quality assurance process.
Headway: Employed AI tools for ad creation and optimization, boosting performance by 40% and reaching 3.3 billion impressions while incorporating AI-generated content in 20% of their paid campaigns.
High
High
Brand sentiment tracking
Monitor and analyze public opinion about a brand across multiple channels in real time
L’Oréal: Analyzed millions of online comments, images, and videos to identify potential product innovation opportunities, effectively tracking brand sentiment and consumer trends.
Kellogg Company: Used AI to scan trending recipes featuring cereal, leveraging this data to launch targeted social campaigns that capitalize on positive brand sentiment and culinary trends.
High
Low
Campaign strategy optimization
Analyze data to predict optimal campaign approaches, channels, and timing
DoorDash: Leveraged Google’s AI-powered Demand Gen tool, which boosted its conversion rate by 15 times and improved cost per action efficiency by 50% compared with previous campaigns.
Kitsch: Employed Meta’s Advantage+ shopping campaigns with AI-powered tools to optimize campaigns, identifying and delivering top-performing ads to high-value consumers.
High
High
Content strategy
Generate content ideas, predict performance, and optimize distribution strategies
JPMorgan Chase: Collaborated with Persado to develop LLMs for marketing copy, achieving up to 450% higher clickthrough rates compared with human-written ads in pilot tests.
Hotel Chocolat: Employed genAI for concept development and production of its Velvetiser TV ad, which earned the highest-ever System1 score for adomestic appliance commercial.
High
High
Personalization strategy development
Create tailored messaging and experiences for consumers at scale
Stitch Fix: Uses genAI to help stylists interpret customer feedback and provide product recommendations, effectively personalizing shopping experiences.
Instacart: Uses genAI to offer customers personalized recipes, mealplanning ideas, and shopping lists based on individual preferences and habits.
Medium
Medium
Share article
Url copied to clipboard
No items found.
Subscribe to our Newsletter
THANK YOU FOR YOUR SUBSCRIPTION
Oops! Something went wrong while submitting the form.
Questions? We have answers
Why is transparency important in programmatic advertising?
Programmatic advertising involves multiple intermediaries—DSPs, SSPs, exchanges, verification vendors, and data providers—each of which adds costs and complexity to the supply chain. Without transparency, advertisers cannot see how much of their budget reaches publishers, how fees are distributed, or whether reported performance accurately reflects campaign outcomes. Transparency enables better budget allocation, fraud detection, and performance optimization.
What are hidden fees in programmatic advertising?
Hidden fees are costs embedded within the programmatic supply chain that are not always disclosed to the advertiser. These may include DSP platform fees, SSP take rates, data targeting surcharges, verification and brand safety costs, and auction-related markups. Because each intermediary operates independently, total fees can accumulate to consume a significant share of the original media budget.
How does the advertising supply chain affect transparency?
The digital advertising supply chain typically involves multiple technology layers between the advertiser and the publisher. Each layer introduces its own pricing, reporting, and data-handling practices. When these layers operate independently and without standardised disclosure requirements, advertisers lose visibility into how their spend is processed, which creates opportunities for inefficiency, fraud, and cost leakage.
Why do walled gardens limit advertising transparency?
Walled gardens—large platforms like Google, Meta, and Amazon—control their own inventory, audience data, measurement models, and reporting dashboards. Because data stays within each platform's ecosystem, advertisers cannot independently verify performance claims, compare metrics consistently across platforms, or access the granular data needed for cross-channel attribution.
How can advertisers improve transparency in digital campaigns?
Advertisers can take several practical steps: request log-level data from programmatic partners, invest in independent verification and measurement tools, consolidate supply paths to reduce intermediary costs, adopt consistent metric definitions across teams and platforms, and implement governance frameworks that define transparency requirements for all media partners.
What role does governance play in advertising transparency?
Governance provides the organisational and structural framework needed to sustain transparency across a fragmented ecosystem. It involves standardising measurement, defining accountability for media partners, establishing reporting requirements, and coordinating media operations across platforms. Without governance, transparency improvements tend to be inconsistent and difficult to maintain at scale.
Have other questions?
If you have more questions, contact us so we can help.

.svg)
.svg)


_%20How%20It%20Works%20%26%20How%20to%20Drive%20Real%20Performance.webp)