Marketing Attribution Models: Types, Comparison, and Limitations
Mary Gabrielyan
July 8, 2026
17
minutes read
Every budget review leans on an attribution model, and the one a team picks decides which channels look like heroes and which look like dead weight. This article explains the main types of marketing attribution models, how they compare, where each works best, and the limitations worth keeping in view before any of them drives a spending decision.
Attribution is among the most relied-upon and most misread parts of marketing measurement. Businesses use it to judge channel performance, tune live campaigns, and divide budgets, yet the same conversion can be credited to three different channels depending on which model is running in the background, and most teams know it. When TransUnion and EMARKETER asked US marketers in October 2025 which measurement problems weighed on them most, the answers clustered around the same theme: 67.4% named proving incremental ROI to justify spend, 66.3% pointed to aligning marketing metrics with business outcomes, and 55.1% cited improving cross-channel attribution accuracy. Those are not the complaints of an industry that has measurement solved.
Marketing attribution models are the frameworks that assign conversion credit across the touchpoints a customer passes through on the way to buying. They are how a business decides that a display impression, a search click, and an email open each deserve some share of the sale, or that only one of them does. The choice of model is not a technical footnote. Different attribution models can change which campaigns appear effective, which budgets grow, and how ROI gets reported, which makes attribution strategy a load-bearing part of modern measurement rather than a reporting afterthought.
What follows is a practical tour of the model types, the trade-offs that separate them, and the gaps that no single model closes on its own.
What are marketing attribution models?
A marketing attribution model is a set of rules for distributing conversion credit across the interactions that preceded a conversion, so a business can see which channels and campaigns appear to be working and fund them accordingly. In practice, attribution tracks the touchpoints a customer hits across channels and devices—an ad seen on a phone, a site visit on a laptop, an email opened days later—and applies a logic for splitting the credit between them.
The important qualifier sits in that word appear. Attribution records the sequence of interactions associated with a conversion; it does not, on its own, demonstrate that any one of those interactions caused the purchase. A customer who would have bought anyway still generates a tidy click path, and the model will credit it just the same. Useful as attribution is for comparing channels and steering optimization, treating its output as proof of true incremental business impact is where most measurement trouble begins. That distinction runs through the rest of this article.
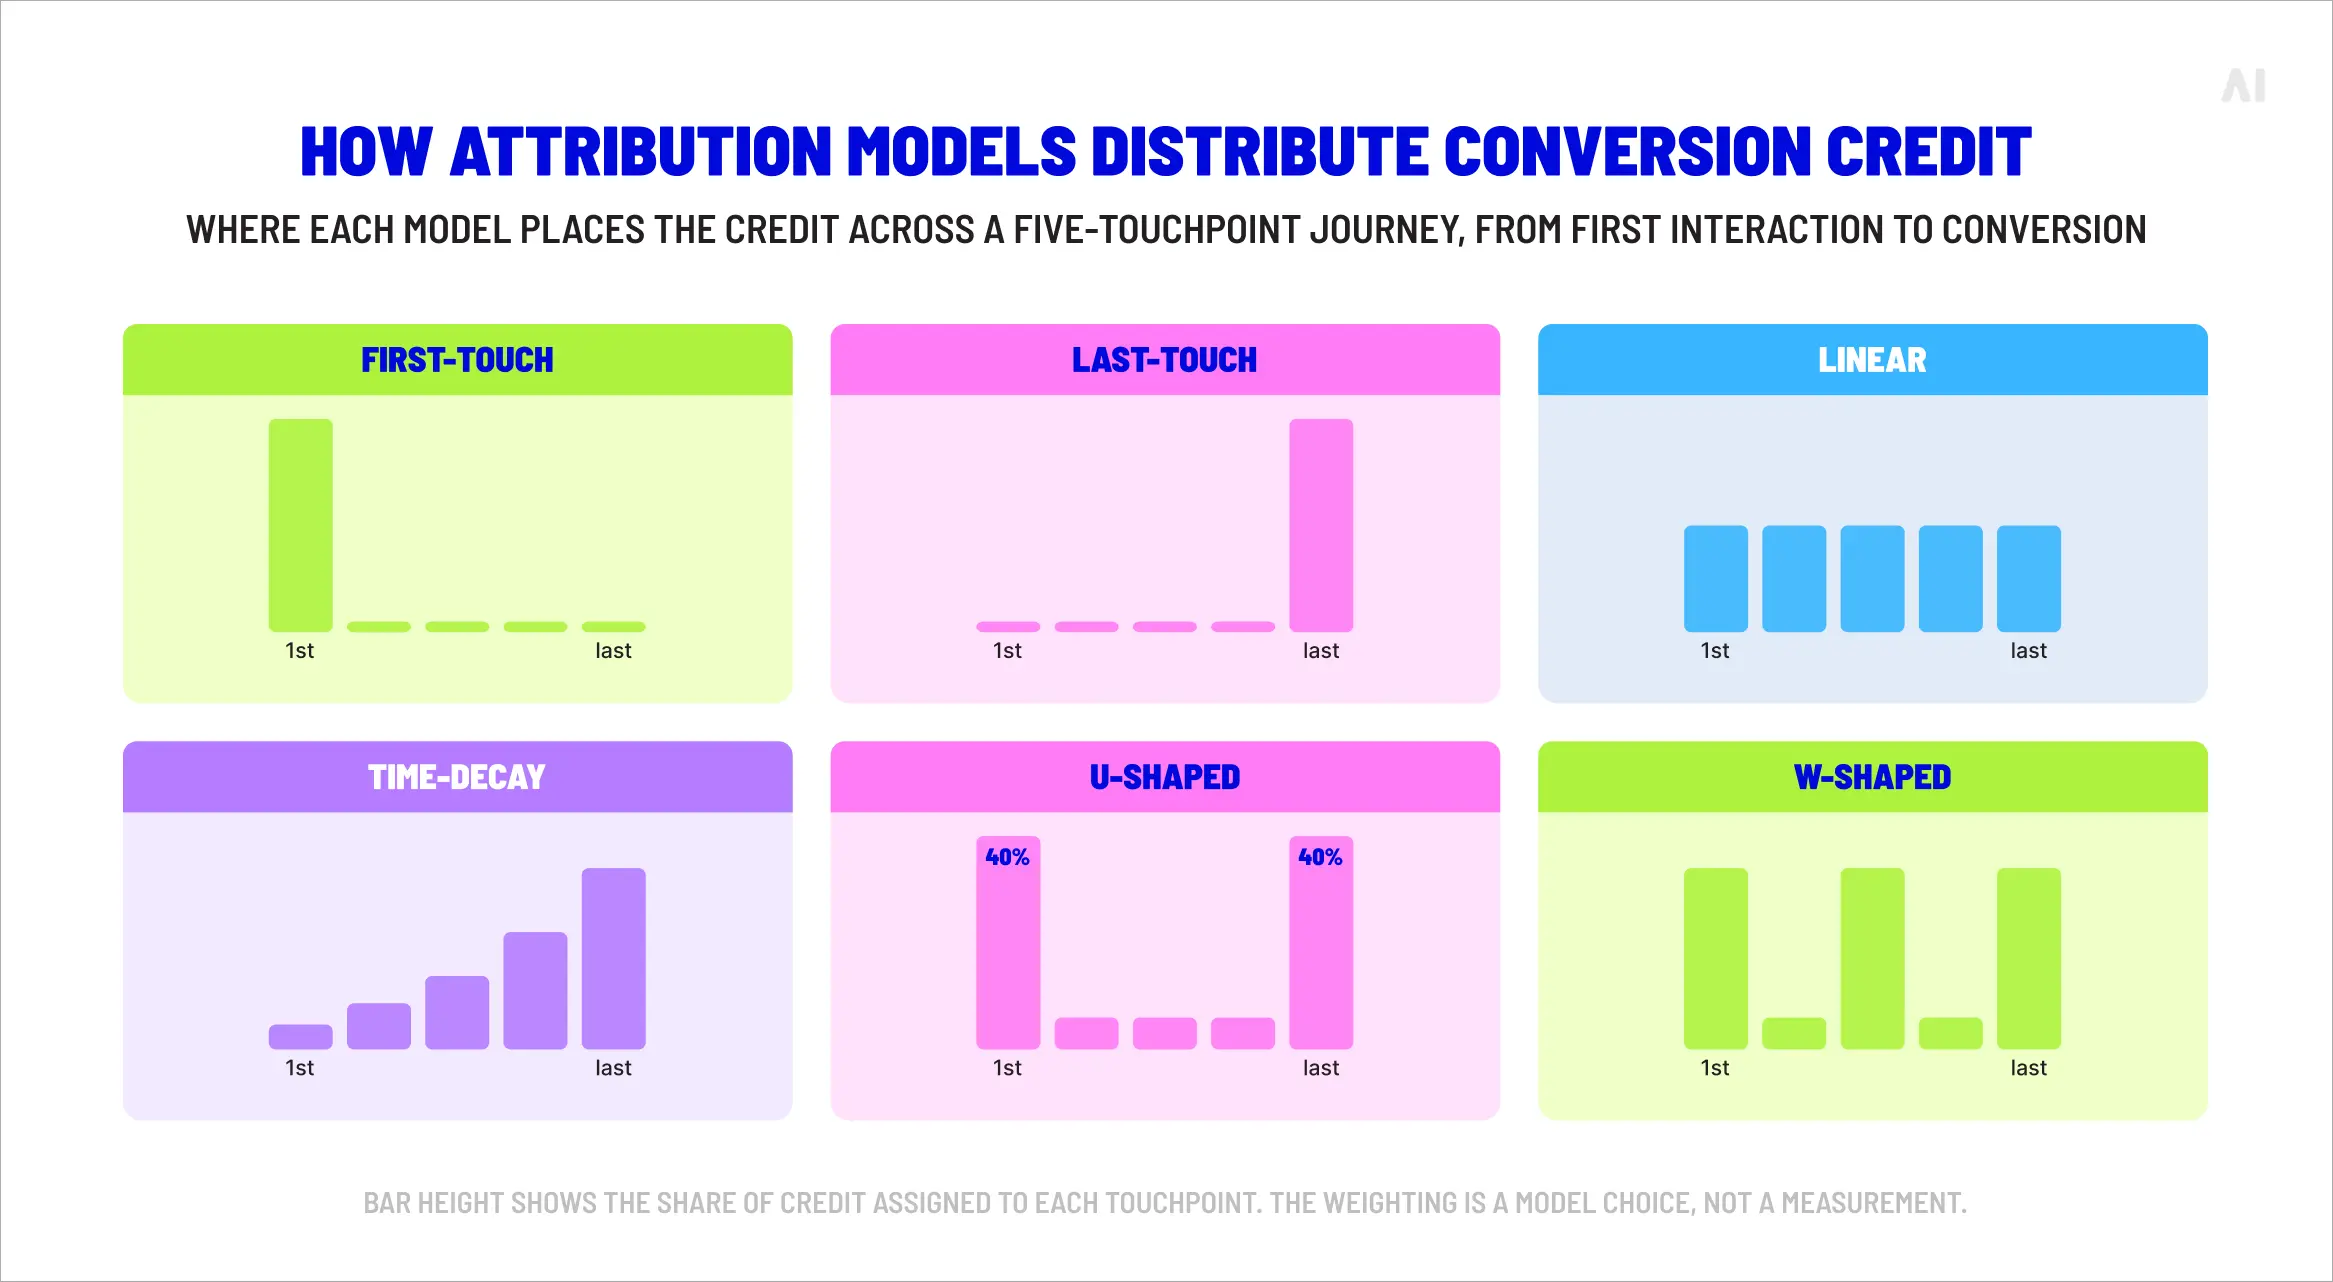
The various types of attribution models differ in one respect above all: how each distributes credit across the touchpoints in a journey, and that single design choice cascades into reporting, optimization, and budget decisions. Give all the credit to the first interaction and acquisition channels look brilliant; give it all to the last and the closing channels do. Spread it evenly and everything looks moderately useful. Because the weighting is a choice rather than a measurement, the model effectively writes part of the conclusion before the data arrives.
Attribution models fall into two main families, with a third, more computational group sitting alongside them.
Single-touch models hand all the credit to one interaction.
Multi-touch models share it across several.
Data-driven and custom models, covered further down, use algorithms or business-specific rules to set the weighting rather than fixing it in advance.
The table below sets the two main families side by side before the sections that follow break each one down.
How attribution models distribute conversion credit.
⚡ The model you choose decides the winner before the data has a say. That is the part most reports leave out.
Single-touch attribution models
Single-touch models assign 100% of conversion credit to a single interaction in the customer journey. Their appeal is straightforward: they are quick to set up, easy to explain to a finance team, and produce an unambiguous answer. The cost of that simplicity is everything they leave out, because a model that credits one touchpoint by definition ignores all the others that helped move the customer along.
First-touch attribution
First-touch attribution gives all the credit to the very first interaction a customer had with a brand. It answers one question cleanly — what introduced this person to us? — which makes it a natural fit for awareness-focused campaigns and acquisition analysis, where the job is to find out which channels are filling the top of the funnel. A team testing a new social channel or content series can use first-touch to see whether it generates initial interest at all.
The blind spot is the rest of the journey. By crediting the opening interaction and nothing else, first-touch undervalues the nurturing and conversion-stage work that turns early interest into a sale. A channel that consistently closes deals can look unimportant under first-touch simply because it rarely starts them.
Last-touch attribution
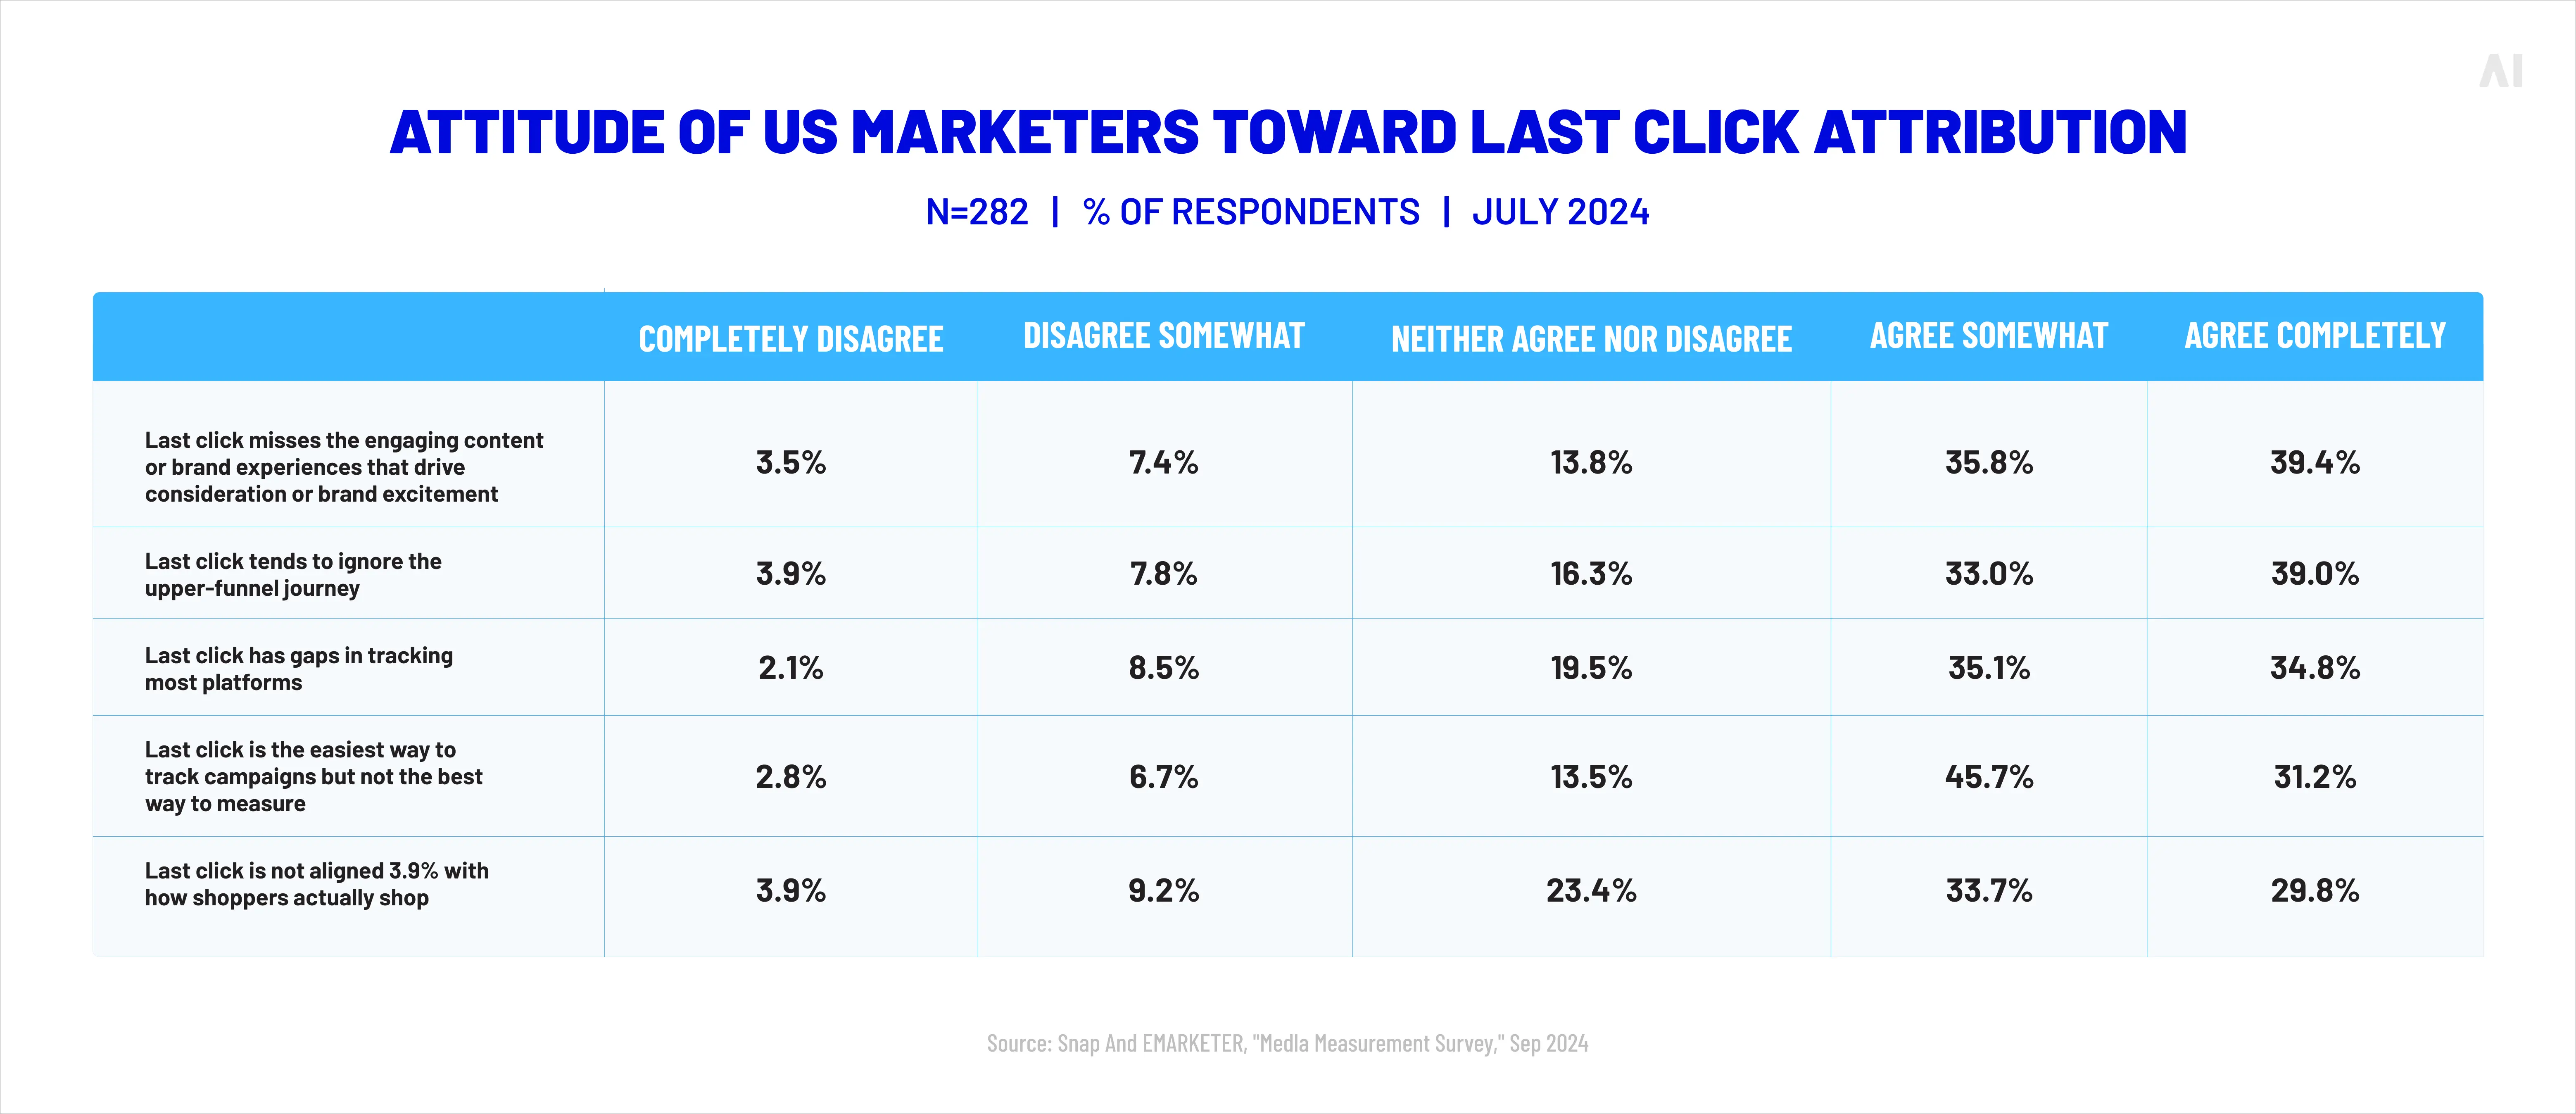
Last-touch attribution does the reverse, assigning all the credit to the final interaction before conversion. It remains the most entrenched model in advertising, partly because it is the path of least resistance: ad platforms and analytics tools have long reported conversions on a last-touch basis within their own walls, and marketers who live inside those dashboards inherited the default. EMARKETER's measurement survey found that 78.4% of marketers still use last-click attribution and web analytics to gauge media efficacy, even as confidence in it erodes — in the same survey, only 21.5% were sure last-click reasonably reflected a platform's long-term impact on the business.
The simplicity that makes last-touch convenient is also what distorts it. By rewarding whatever happened immediately before the sale, it inflates bottom-funnel channels such as branded search, remarketing, and direct traffic, while starving the awareness and consideration activity that fed the customer into that final click.
The drift away from it is visible even at the platforms that popularised it: Google has narrowed its Google Ads attribution choices to two models, data-driven and last-click, with data-driven now the default for most conversion actions, and Google Analytics 4 likewise made data-driven its standard. Last-click has gone from the obvious choice to the conservative fallback.
Multi-touch attribution models
Multi-touch attribution models distribute conversion credit across several of the interactions in a customer journey rather than resting the whole verdict on one. The premise is that buying is rarely a single moment, so the credit should reflect the chain of touchpoints that contributed. Where the models differ is in how they apportion that credit, and each weighting scheme carries its own assumptions about which moments count for most.
Linear attribution
Linear attribution divides credit equally among every touchpoint in the journey. No interaction is privileged; a first-touch display ad and a final-touch search click each receive the same share. The even-handedness makes linear a sensible starting point for B2B, SaaS, and other multi-channel campaigns with long sales cycles, where a buyer may engage a dozen times across months and no single contact obviously deserves the lion's share.
The same evenness is its weakness. Treating every touchpoint as equally influential is convenient but rarely true — a passing banner impression and a 40-minute demo call almost certainly did not contribute the same amount, yet linear records them identically. It tidies the journey at the cost of flattening the real differences within it.
Time-decay attribution
Time-decay attribution weights interactions by recency, handing progressively more credit to the touchpoints closer to the conversion. The reasoning is that interactions nearer the decision tend to carry more weight in it. That logic suits short sales cycles and retargeting-led campaigns, where the final stretch of the journey does much of the persuading and the model's bias toward late touchpoints broadly matches reality.
For longer or awareness-driven journeys, the recency bias becomes a liability. Time-decay systematically discounts the upper-funnel channels that created demand weeks before a purchase, which can make brand and consideration work look weaker than it is and nudge budget toward the bottom of the funnel.
U-shaped attribution
U-shaped attribution, also called position-based, concentrates credit at two points: the first interaction and the lead-conversion moment, with the touchpoints in between sharing a smaller remainder. A common split assigns 40% to each of those anchor points and spreads the final 20% across the middle. The pattern suits lead generation and B2B funnels, where the first contact and the moment a prospect becomes a qualified lead are both genuinely pivotal.
The catch is that the weighting is a built-in assumption rather than anything measured. The model decides in advance that the first and lead-conversion touchpoints deserve the most credit and applies that judgement uniformly, regardless of whether a particular journey actually worked that way. It is a reasonable heuristic, not a finding.
W-shaped attribution
W-shaped attribution extends the same position-based logic to three weighted stages: the first interaction, the lead-creation moment, and the opportunity-creation stage deeper in the pipeline. Each of those milestones takes a substantial share of credit, with the rest distributed across the remaining touchpoints. For complex sales funnels and enterprise marketing, where deals progress through clearly defined stages, W-shaped offers a fuller picture than models that recognise only one or two key moments.
That richness comes at a price. W-shaped attribution generally requires tight CRM integration to track opportunities through the pipeline, and it is more involved to set up and maintain than the simpler models. The detail is valuable for organisations equipped to support it and burdensome for those that are not.
Data-driven and custom attribution models
Beyond the fixed-rule models sits a more computational tier, where the weighting is derived rather than declared. These approaches lean on algorithms, machine learning, and business-specific logic to decide how credit should fall, which can produce a more faithful read of a particular business — and a more demanding set of requirements to run it well.
AI-driven attribution models
AI-driven and data-driven attribution models use machine learning trained on historical conversion data to distribute credit dynamically across touchpoints. Rather than applying a preset pattern, the model compares the journeys of customers who converted against those who did not and infers which interactions actually move the needle, adjusting the weighting as patterns change. Done well, this sharpens optimization, supports predictive analysis, and reads cross-channel performance more accurately than any rules-based alternative.
The trade-offs are real and worth naming. Data-driven models are only as sound as the data feeding them, so thin or messy inputs produce confident-looking nonsense. Many implementations live inside a single platform, which reintroduces the dependency and self-interest the model was meant to escape. And the algorithmic weighting is harder to interrogate than a simple rule, so a marketer who cannot see why the model credited a channel is taking the output partly on trust.
⚡ A data-driven model is only as honest as the data behind it and the platform that runs it. Neither is a given.
Custom attribution models
Custom attribution models discard the standard templates in favour of rules built around a specific business — its real sales cycle, its actual customer journeys, the buying behaviour its own data reveals. A subscription business with a 60-day evaluation period and a heavy reliance on free trials can encode those realities directly, rather than bending its measurement to fit a model designed for impulse ecommerce.
The freedom suits enterprise organisations with mature analytics infrastructure and the staff to maintain it. For everyone else, the risks accumulate: models can be over-engineered into fragility, starved of the data volume they need to be reliable, or left to rot as the business changes and nobody updates the rules. A custom model is a living system, and it repays the upkeep it demands.
Choosing the right attribution model for your business
There is no single best attribution model, only the one that fits a particular business, sales cycle, and set of goals. Put another way, the best marketing attribution models are simply the ones matched to how a given business actually sells. An ecommerce brand closing sales in an afternoon and a B2B firm nurturing a deal across nine months have almost nothing in common in how their customers buy, so they have no business using the same measurement logic. The sections below match model types to the environments where they tend to earn their keep.
For ecommerce
Ecommerce journeys are typically short, high-volume, and heavy on retargeting, which suits models that can keep up with the pace. Last-touch offers a fast, legible read for businesses where the path to purchase is genuinely brief, time-decay fits the retargeting-driven push toward checkout by rewarding the late touchpoints that close the sale, and data-driven attribution comes into its own once conversion volume is high enough to train a model reliably. The higher the order volume, the more a data-driven approach can sharpen what the simpler models only approximate.
For B2B and lead generation
B2B and lead generation invert the ecommerce picture: long cycles, many touchpoints, and a CRM-shaped funnel that runs from first contact to closed deal. That structure rewards models built to recognise more than one decisive moment. Linear suits teams that want a baseline view across a sprawling journey, U-shaped credits the two anchor points most B2B marketers care about — the first touch and the lead conversion — and W-shaped goes further by recognising opportunity creation as a third milestone, which fits enterprise funnels with defined pipeline stages and the CRM integration to track them.
Awareness campaigns are the ones most likely to be punished by conversion-focused reporting, because the work they do happens far from the final click and rarely shows up in bottom-funnel models. First-touch and position-based attribution help correct that by crediting the early interactions that introduce a brand and start a journey. For teams trying to defend upper-funnel investment, a model that can see the opening move is the difference between a brand budget that survives the next review and one that gets reallocated to retargeting.
For omnichannel marketing
Omnichannel journeys are where fixed-rule models struggle most, because customers move between apps, browser tabs, physical stores, emails, and social feeds in an order no template anticipates — often doubling back and changing devices mid-decision in ways that would give any rules-based model a headache. Data-driven and custom models are better suited here, since they can absorb the messiness of multi-device, online-to-offline paths and weight touchpoints by what the data shows rather than where they happen to sit in a predefined pattern. The more channels and devices in play, the less a one-size template has to offer.
Attribution models comparison table
The table below summarises the models covered so far, so the differences in how they assign credit, where they fit, and where they fall short can be read at a glance. It is a quick way to narrow the field to the two or three models worth testing against a particular business.
Limitations of marketing attribution models
Every attribution model is, at bottom, a story about who gets the credit, and like any story it can be told persuasively and still be wrong. The models are genuinely useful, but their output arrives with a set of structural gaps that no amount of dashboard polish closes. Understanding those gaps is what separates a marketer who uses attribution from one who is used by it.
The deepest limitation is also the easiest to forget: a touchpoint appearing before a conversion does not prove it caused the conversion. Attribution records correlation — this interaction happened, then the sale happened — and correlation is not influence. A customer already determined to buy will still click the retargeting ad served to them, and last-touch will dutifully credit that ad for a decision it had nothing to do with. Without a way to ask what would have happened in the ad's absence, attribution cannot tell a touchpoint that drove a sale from one that merely witnessed it.
Most advertising platforms run their own attribution logic and, unsurprisingly, that logic tends to flatter the platform. Each walled garden measures conversions by its own rules and within its own boundaries, so the same sale can be claimed in full by several platforms at once, inflating the totals and leaving the marketer to reconcile numbers that refuse to add up. The accountability pressure is rising as a result: the IAB's work on commerce media found that 88% of buyers demand ROAS reporting while only 71% of retail media networks supply it consistently, a gap that says as much about platform self-interest as it does about technical capability. Self-attribution bias is not a bug in any one platform; it is the predictable result of letting each one grade its own homework.
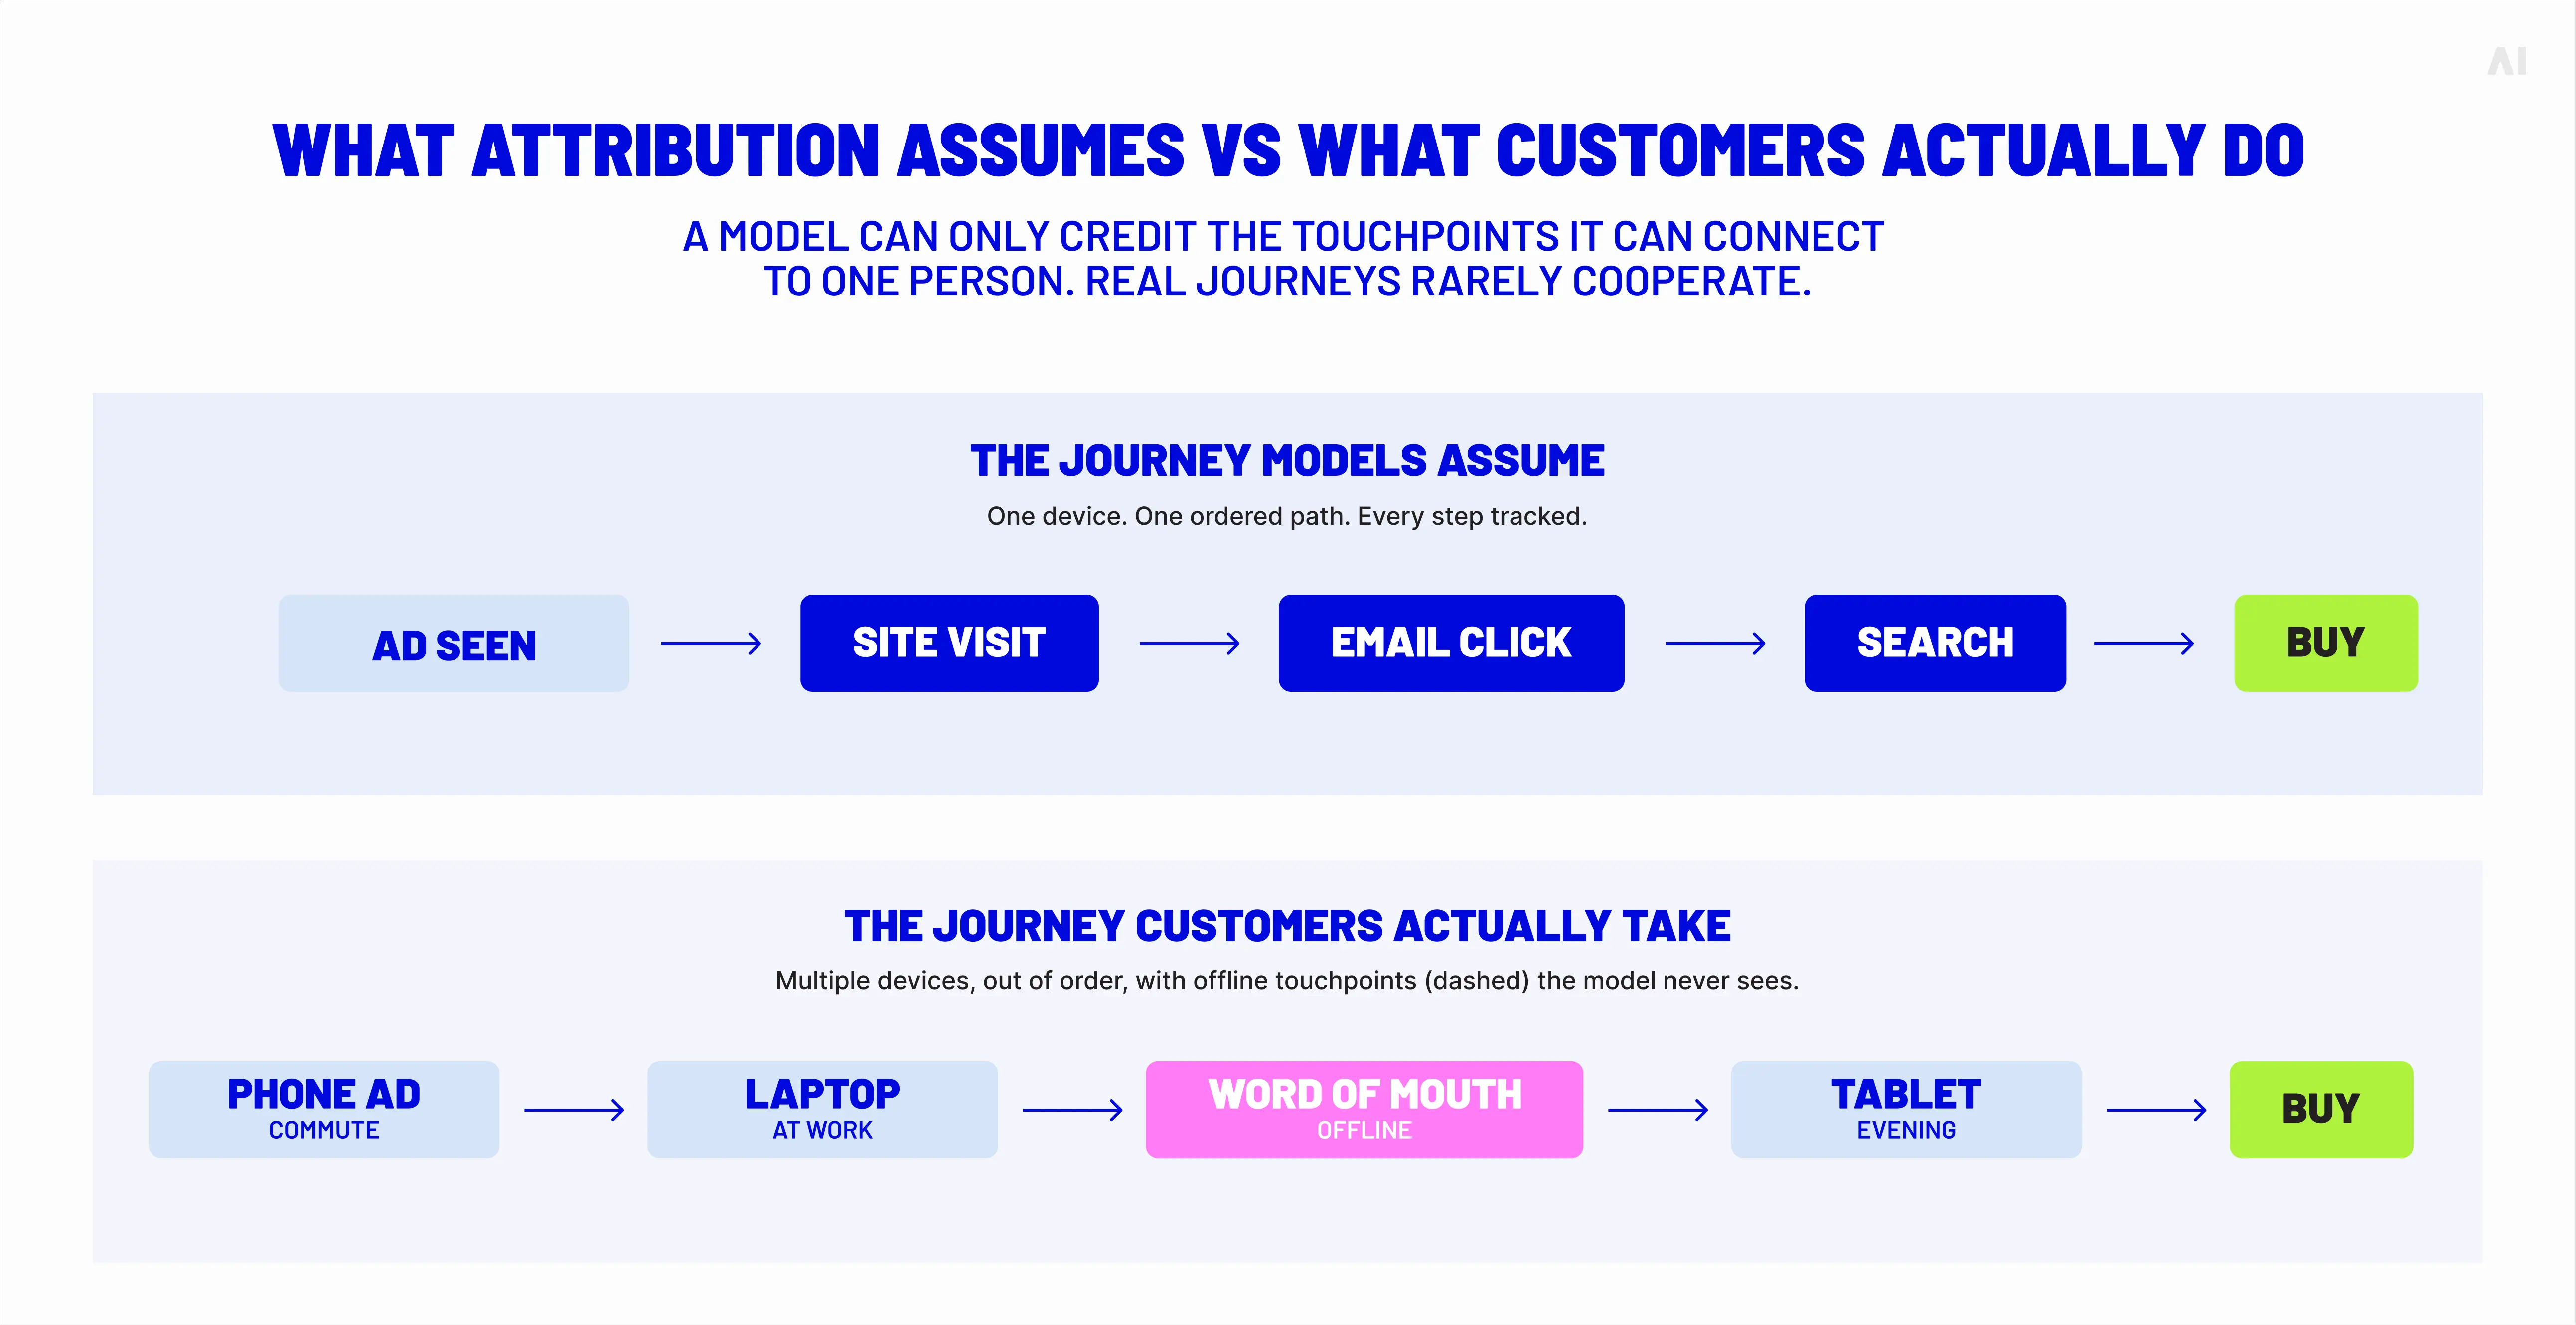
The clean linear path that attribution models assume rarely exists. Real journeys fragment across phones, laptops, tablets, apps, and browsers, and unless every fragment can be stitched back to one person, the model sees several disconnected strangers instead of a single customer changing screens. A journey that starts on a commute, resumes at a work desk, and finishes on a sofa that evening can register as three separate users, none of whom appears to convert in a sensible way. The result is incomplete reporting that understates how much work the early, harder-to-track touchpoints did.
What attribution assumes vs what customers actually do
A great deal of what actually persuades people happens where no pixel can follow. Sales calls, word-of-mouth recommendations, in-store visits, referrals, and the dark-social sharing that moves through private messages and group chats all influence buying decisions and leave almost no trace in the attribution layer. For businesses where offline influence is substantial, attribution measures the visible slice of the journey and silently omits the rest, which can make digitally trackable channels look more decisive than they are.
Privacy changes reduced attribution visibility
The ground attribution stands on has shifted under it. Third-party cookie deprecation, consent requirements, and Apple's tracking restrictions have all cut into the user-level data that detailed attribution depends on, and platforms increasingly fill the gaps with modelled conversions — estimates rather than observations. AI-driven modelling and predictive analytics now do real work here, reconstructing a usable picture of performance where direct measurement has gone dark, but the underlying point holds: a growing share of attribution data is inferred, and inference carries uncertainty that a confident dashboard tends to hide.
⚡ Attribution measures what it can see. The trouble is that most of what moves a buyer happens where it cannot look.
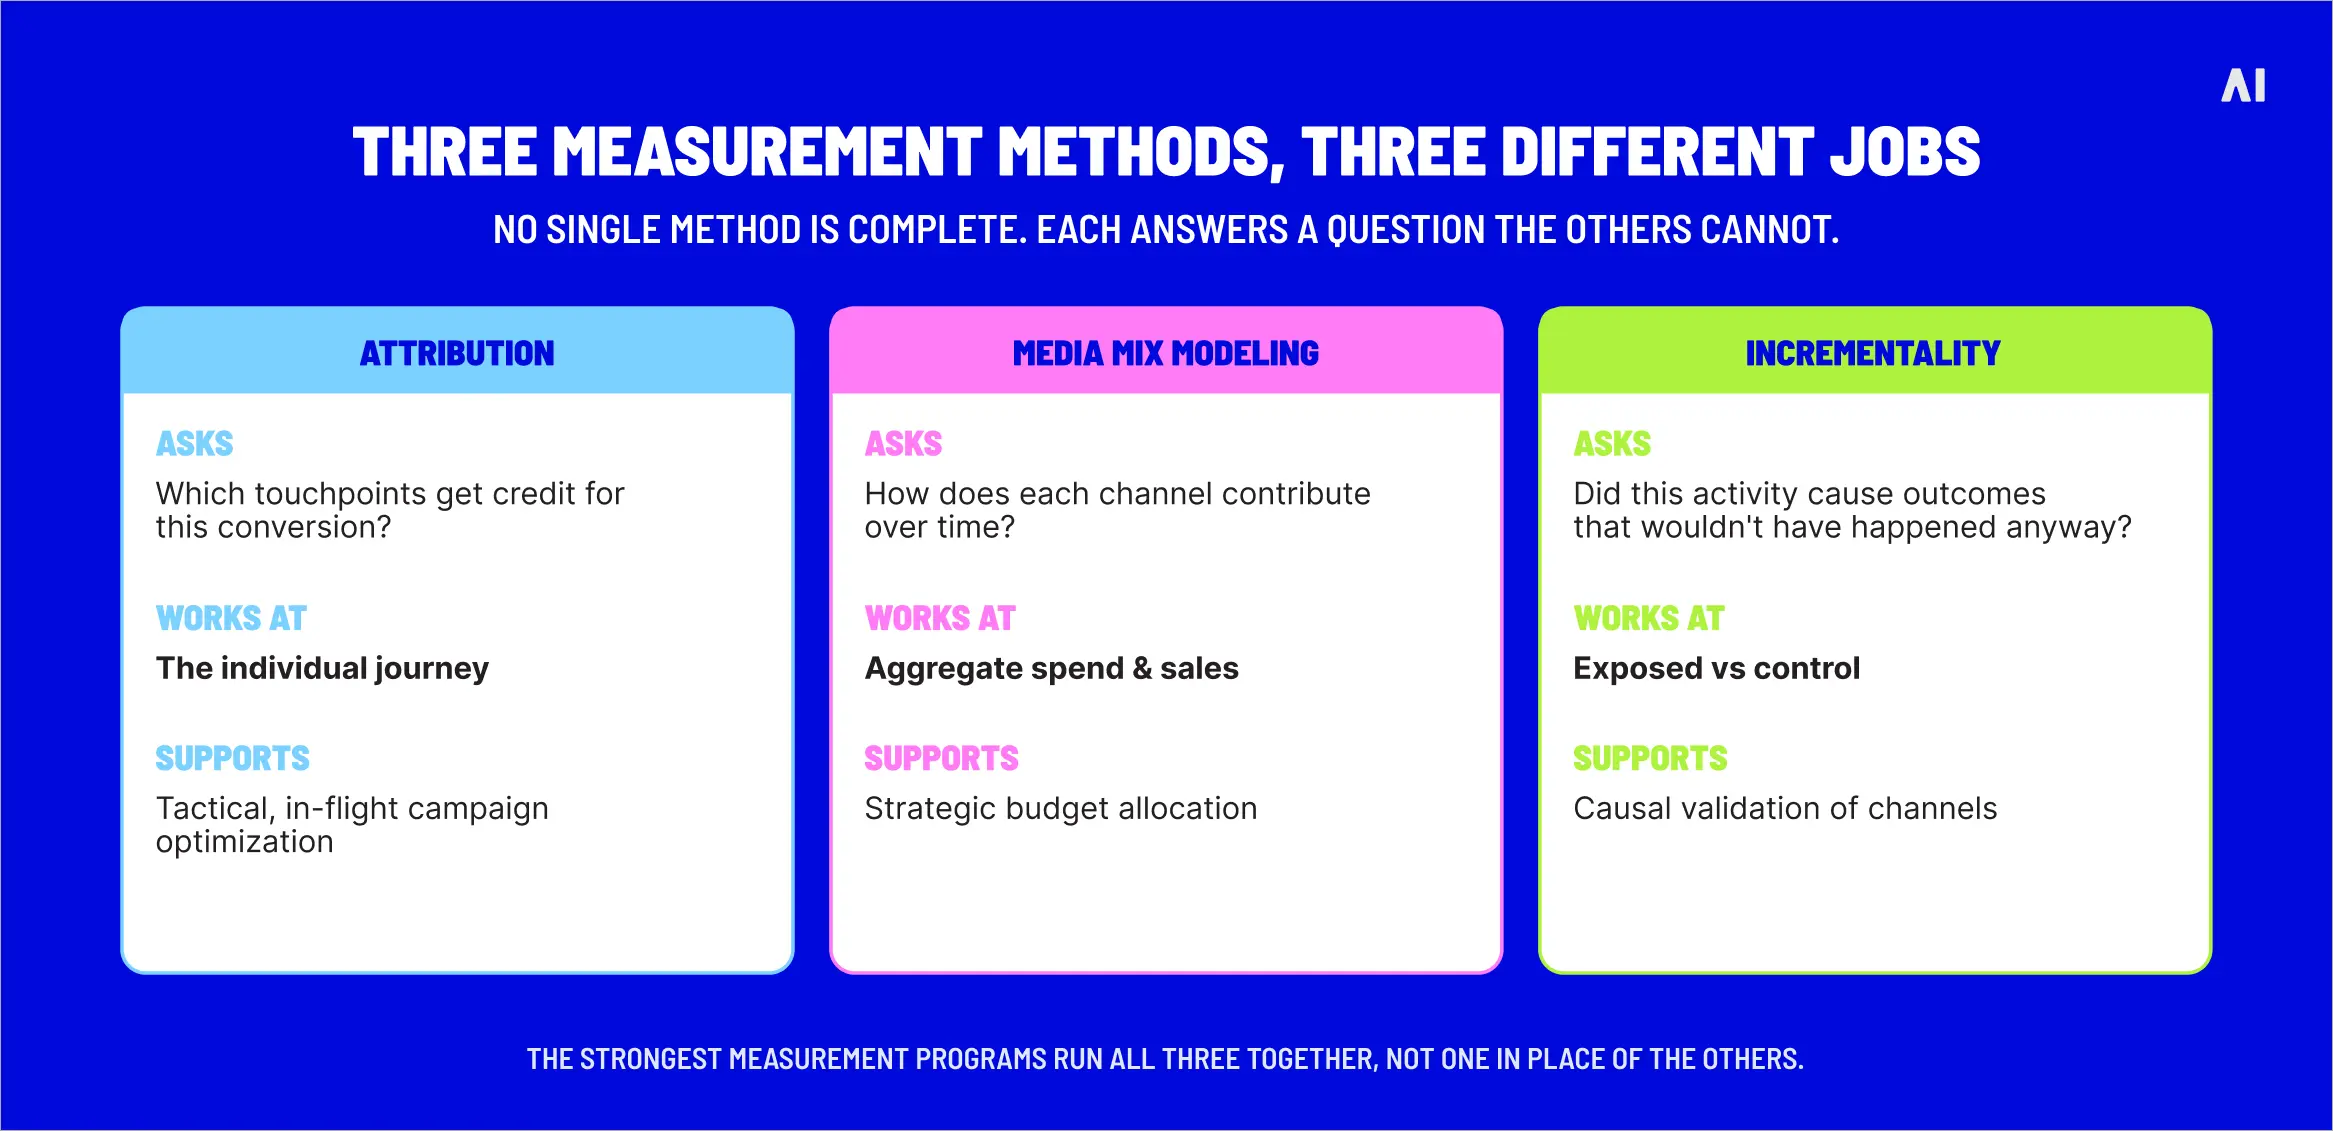
Attribution vs media mix modeling vs incrementality
Attribution is one of three measurement approaches businesses use to understand marketing performance, and the pressure to get the combination right is climbing as spending does — the IAB expects commerce media alone to exceed $150 billion across the US and Europe, with every dollar of it under demand to prove its worth. Attribution, media mix modeling, and incrementality testing answer different questions, and confusing them for one another is a reliable way to misread a campaign.
Attribution and media mix modeling work at opposite scales.
Attribution operates at the level of the individual journey, tracking the touchpoints a single customer hit and assigning credit among them — granular, fast to refresh, and well suited to deciding which channels or creatives to adjust this week.
Media mix modelingsteps back to the aggregate, analysing total spend, total outcomes, and external factors such as seasonality and competitor activity over months to estimate how each channel contributes to the business overall, including the offline and upper-funnel activity attribution cannot see.
One is a tactical instrument for in-flight decisions; the other is a strategic one for setting the next quarter's budget. The two frequently disagree, and the disagreement is informative rather than a fault, since each captures what the other misses.
Attribution vs incrementality testing
Where attribution assigns credit, incrementality testing asks the harder question of cause. The IAB's November 2025 commerce media guidelines define incrementality as the causal impact of marketing — the additional outcomes directly driven by a campaign compared with what would have happened without it, which is precisely the question attribution cannot answer. Incrementality establishes that answer experimentally, comparing an exposed group against an unexposed control and reading the lift between them, and the IAB groups the available methods into four categories: experiments, model-based counterfactuals, econometric models, and hybrid proxies.
The trade-off is rigour against reach — incrementality gives a clean causal read on a single hypothesis at a time, where attribution gives a broad, continuous, but correlational view of the whole journey. The two are complements, not rivals.
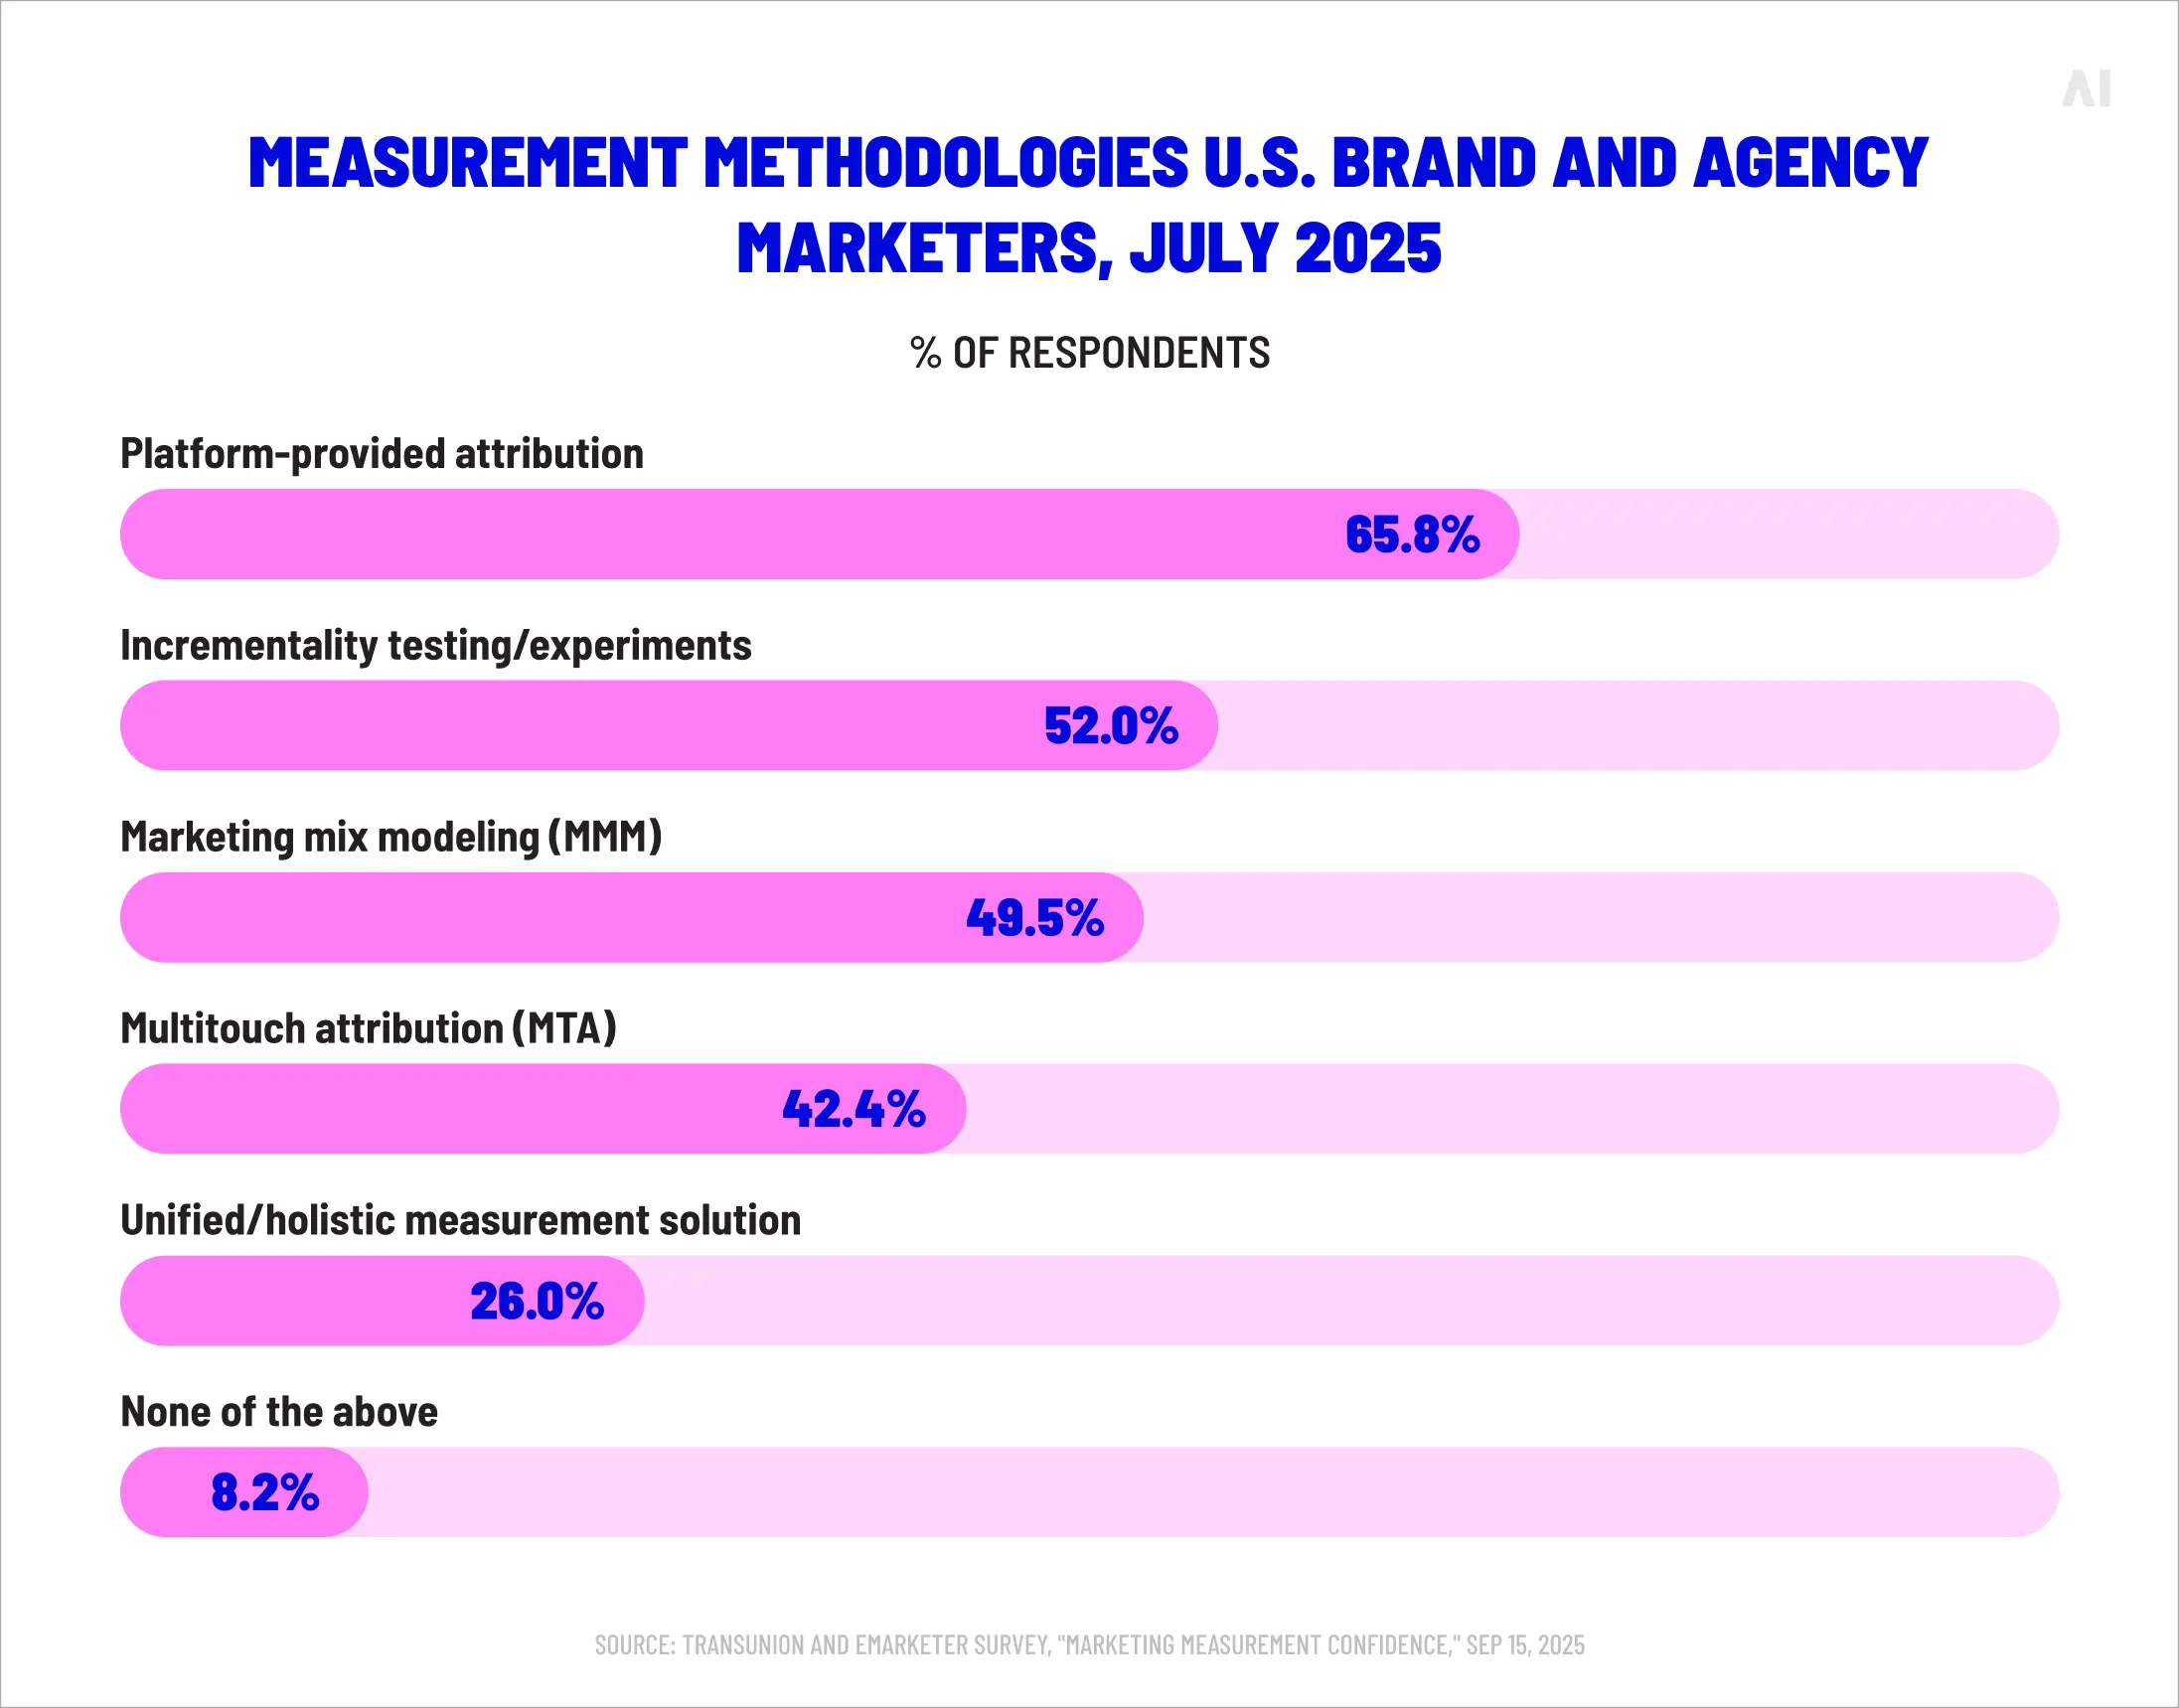
Most reliable measurement methodology (MMM vs MTA vs unified; Source)
When attribution models are most useful
For all the limitations, attribution remains a genuinely valuable tool, and the case against over-trusting it is not a case against using it. Its strengths are real wherever the question is comparative and the journey is largely trackable. Attribution earns its place in a few situations in particular:
Channel comparison, where the goal is a quick read on which channels are pulling their weight relative to one another.
Creative testing, where attribution can show which variants are associated with conversions before a fuller analysis is run.
Budget optimization, where in-flight credit signals help move spend toward what is working this week.
Lead generation analysis, where multi-touch models map the path from first contact to qualified lead.
Customer acquisition reporting, where first-touch and similar models show which channels are filling the top of the funnel.
The common thread is that attribution is at its best as a fast, directional, tactical instrument. Asked to do that job, it does it well; asked to stand in for proof of business impact, it overreaches.
How to use attribution models more effectively
The way to get more from attribution is to stop asking it to work alone and start surrounding it with better data, clearer goals, and methods that cover its blind spots. A handful of practical habits separate teams that use attribution well from those that are quietly misled by it.
No single reporting source tells the whole truth, so the strongest measurement programmes blend several — attribution for tactical reads, MMM for strategic allocation, incrementality for causal validation, and CRM data to ground all of it in real outcomes. Relying on one platform's attribution alone reintroduces exactly the bias that triangulation is meant to remove.
AI Digital's Open Garden frameworkis built around this principle, prioritising cross-channel visibility and neutral, platform-agnostic measurement over the siloed reporting a single walled garden provides, so the picture a marketer works from is not quietly shaped by whichever platform produced it.
The right model depends on what the business is trying to achieve, and the priority changes with the objective — an awareness push, a lead-generation drive, a customer-acquisition target, and a revenue-growth goal each call for a different way of crediting the journey. Settling the goal first, then choosing the model that serves it, avoids the common error of optimizing hard toward a number that was never the point.
AI Digital's Elevate, a marketing intelligence platform, supports this by connecting performance optimization with smarter budget allocation across the customer journey, including marketing mix modeling for full-funnel contribution and path-to-conversion analysis that shows the touchpoints behind a conversion rather than only the last click.
Attribution is only as reliable as the data underneath it, which makes routine data hygiene unglamorous but decisive. Conversion tracking drifts, tags break, CRM records fall out of sync, and a model fed stale or duplicated data will report with total confidence and complete inaccuracy. Regular data governance — validating conversions, keeping CRM integration current, and checking tracking for consistency across channels — is what keeps attribution honest.
4. Avoid optimizing only for ROAS
Return on ad spend is a useful metric and a dangerous master. Optimizing for ROAS alone steers budget toward whatever converts cheapest right now, which often means over-funding bottom-funnel channels that harvest existing demand while starving the activity that creates it. A fuller view weighs profitability, customer lifetime value, and inventory availability alongside the platform's ROAS figure, so the channel that looks most efficient on a dashboard is not automatically the one that builds the business.
AI Digital's Smart Supply supports the media side of that discipline by curating the inventory a campaign buys — filtering out low-value and fraudulent impressions and shortening the supply path — so a strong ROAS reflects genuinely effective spend rather than cheap, low-quality placements.
Make attribution models part of your measurement strategy
Attribution models are worth keeping — they are a sharp, fast way to compare channels and read customer journeys, and abandoning them would be its own mistake. What they are not is a complete account of business impact. A model that credits touchpoints cannot, by itself, prove that those touchpoints caused anything, and when three platforms each claim the same conversion, somebody's arithmetic is being generous. The way through is to treat attribution as one instrument among several, pairing it with incrementality testing for causation, experimentation for validation, media mix modeling for strategic allocation, and revenue analysis to tie all of it back to the business. Used that way, attribution stops being a source of false confidence and becomes a genuinely useful part of a wider measurement strategy.
If you are working to build that fuller picture, AI Digital can help. As an end-to-end programmatic consultancy, AI Digital combines neutral, cross-channel measurement through the Open Garden framework, marketing intelligence and attribution analysis through Elevate, and supply curation through Smart Supply, so attribution insight connects to the strategy and operations around it. Get in touch to talk through how it would fit your measurement setup.
Blind spot
Key issues
Business impact
AI Digital solution
Lack of transparency in AI models
• Platforms own AI models and train on proprietary data • Brands have little visibility into decision-making • "Walled gardens" restrict data access
• Inefficient ad spend • Limited strategic control • Eroded consumer trust • Potential budget mismanagement
Open Garden framework providing: • Complete transparency • DSP-agnostic execution • Cross-platform data & insights
Optimizing ads vs. optimizing impact
• AI excels at short-term metrics but may struggle with brand building • Consumers can detect AI-generated content • Efficiency might come at cost of authenticity
• Short-term gains at expense of brand health • Potential loss of authentic connection • Reduced effectiveness in storytelling
Smart Supply offering: • Human oversight of AI recommendations • Custom KPI alignment beyond clicks • Brand-safe inventory verification
The illusion of personalization
• Segment optimization rebranded as personalization • First-party data infrastructure challenges • Personalization vs. surveillance concerns
• Potential mismatch between promise and reality • Privacy concerns affecting consumer trust • Cost barriers for smaller businesses
Elevate platform features: • Real-time AI + human intelligence • First-party data activation • Ethical personalization strategies
AI-Driven efficiency vs. decision-making
• AI shifting from tool to decision-maker • Black box optimization like Google Performance Max • Human oversight limitations
• Strategic control loss • Difficulty questioning AI outputs • Inability to measure granular impact • Potential brand damage from mistakes
Managed Service with: • Human strategists overseeing AI • Custom KPI optimization • Complete campaign transparency
Fig. 1. Summary of AI blind spots in advertising
Dimension
Walled garden advantage
Walled garden limitation
Strategic impact
Audience access
Massive, engaged user bases
Limited visibility beyond platform
Reach without understanding
Data control
Sophisticated targeting tools
Data remains siloed within platform
Fragmented customer view
Measurement
Detailed in-platform metrics
Inconsistent cross-platform standards
Difficult performance comparison
Intelligence
Platform-specific insights
Limited data portability
Restricted strategic learning
Optimization
Powerful automated tools
Black-box algorithms
Reduced marketer control
Fig. 2. Strategic trade-offs in walled garden advertising.
Core issue
Platform priority
Walled garden limitation
Real-world example
Attribution opacity
Claiming maximum credit for conversions
Limited visibility into true conversion paths
Meta and TikTok's conflicting attribution models after iOS privacy updates
Data restrictions
Maintaining proprietary data control
Inability to combine platform data with other sources
Amazon DSP's limitations on detailed performance data exports
Cross-channel blindspots
Keeping advertisers within ecosystem
Fragmented view of customer journey
YouTube/DV360 campaigns lacking integration with non-Google platforms
Black box algorithms
Optimizing for platform revenue
Reduced control over campaign execution
Self-serve platforms using opaque ML models with little advertiser input
Performance reporting
Presenting platform in best light
Discrepancies between platform-reported and independently measured results
Consistently higher performance metrics in platform reports vs. third-party measurement
Fig. 1. The Walled garden misalignment: Platform interests vs. advertiser needs.
Key dimension
Challenge
Strategic imperative
ROAS volatility
Softer returns across digital channels
Shift from soft KPIs to measurable revenue impact
Media planning
Static plans no longer effective
Develop agile, modular approaches adaptable to changing conditions
Brand/performance
Traditional division dissolving
Create full-funnel strategies balancing long-term equity with short-term conversion
Capability
Key features
Benefits
Performance data
Elevate forecasting tool
• Vertical-specific insights • Historical data from past economic turbulence • "Cascade planning" functionality • Real-time adaptation
• Provides agility to adjust campaign strategy based on performance • Shows which media channels work best to drive efficient and effective performance • Confident budget reallocation • Reduces reaction time to market shifts
• Dataset from 10,000+ campaigns • Cuts response time from weeks to minutes
• Reaches people most likely to buy • Avoids wasted impressions and budgets on poor-performing placements • Context-aligned messaging
• 25+ billion bid requests analyzed daily • 18% improvement in working media efficiency • 26% increase in engagement during recessions
Full-funnel accountability
• Links awareness campaigns to lower funnel outcomes • Tests if ads actually drive new business • Measures brand perception changes • "Ask Elevate" AI Chat Assistant
• Upper-funnel to outcome connection • Sentiment shift tracking • Personalized messaging • Helps balance immediate sales vs. long-term brand building
• Natural language data queries • True business impact measurement
Open Garden approach
• Cross-platform and channel planning • Not locked into specific platforms • Unified cross-platform reach • Shows exactly where money is spent
• Reduces complexity across channels • Performance-based ad placement • Rapid budget reallocation • Eliminates platform-specific commitments and provides platform-based optimization and agility
• Coverage across all inventory sources • Provides full visibility into spending • Avoids the inability to pivot across platform as you’re not in a singular platform
Fig. 1. How AI Digital helps during economic uncertainty.
Trend
What it means for marketers
Supply & demand lines are blurring
Platforms from Google (P-Max) to Microsoft are merging optimization and inventory in one opaque box. Expect more bundled “best available” media where the algorithm, not the trader, decides channel and publisher mix.
Walled gardens get taller
Microsoft’s O&O set now spans Bing, Xbox, Outlook, Edge and LinkedIn, which just launched revenue-sharing video programs to lure creators and ad dollars. (Business Insider)
Retail & commerce media shape strategy
Microsoft’s Curate lets retailers and data owners package first-party segments, an echo of Amazon’s and Walmart’s approaches. Agencies must master seller-defined audiences as well as buyer-side tactics.
AI oversight becomes critical
Closed AI bidding means fewer levers for traders. Independent verification, incrementality testing and commercial guardrails rise in importance.
Fig. 1. Platform trends and their implications.
Metric
Connected TV (CTV)
Linear TV
Video Completion Rate
94.5%
70%
Purchase Rate After Ad
23%
12%
Ad Attention Rate
57% (prefer CTV ads)
54.5%
Viewer Reach (U.S.)
85% of households
228 million viewers
Retail Media Trends 2025
Access Complete consumer behaviour analyses and competitor benchmarks.
Identify and categorize audience groups based on behaviors, preferences, and characteristics
Michaels Stores: Implemented a genAI platform that increased email personalization from 20% to 95%, leading to a 41% boost in SMS click through rates and a 25% increase in engagement.
Estée Lauder: Partnered with Google Cloud to leverage genAI technologies for real-time consumer feedback monitoring and analyzing consumer sentiment across various channels.
High
Medium
Automated ad campaigns
Automate ad creation, placement, and optimization across various platforms
Showmax: Partnered with AI firms toautomate ad creation and testing, reducing production time by 70% while streamlining their quality assurance process.
Headway: Employed AI tools for ad creation and optimization, boosting performance by 40% and reaching 3.3 billion impressions while incorporating AI-generated content in 20% of their paid campaigns.
High
High
Brand sentiment tracking
Monitor and analyze public opinion about a brand across multiple channels in real time
L’Oréal: Analyzed millions of online comments, images, and videos to identify potential product innovation opportunities, effectively tracking brand sentiment and consumer trends.
Kellogg Company: Used AI to scan trending recipes featuring cereal, leveraging this data to launch targeted social campaigns that capitalize on positive brand sentiment and culinary trends.
High
Low
Campaign strategy optimization
Analyze data to predict optimal campaign approaches, channels, and timing
DoorDash: Leveraged Google’s AI-powered Demand Gen tool, which boosted its conversion rate by 15 times and improved cost per action efficiency by 50% compared with previous campaigns.
Kitsch: Employed Meta’s Advantage+ shopping campaigns with AI-powered tools to optimize campaigns, identifying and delivering top-performing ads to high-value consumers.
High
High
Content strategy
Generate content ideas, predict performance, and optimize distribution strategies
JPMorgan Chase: Collaborated with Persado to develop LLMs for marketing copy, achieving up to 450% higher clickthrough rates compared with human-written ads in pilot tests.
Hotel Chocolat: Employed genAI for concept development and production of its Velvetiser TV ad, which earned the highest-ever System1 score for adomestic appliance commercial.
High
High
Personalization strategy development
Create tailored messaging and experiences for consumers at scale
Stitch Fix: Uses genAI to help stylists interpret customer feedback and provide product recommendations, effectively personalizing shopping experiences.
Instacart: Uses genAI to offer customers personalized recipes, mealplanning ideas, and shopping lists based on individual preferences and habits.
Medium
Medium
Share article
Url copied to clipboard
No items found.
Subscribe to our Newsletter
THANK YOU FOR YOUR SUBSCRIPTION
Oops! Something went wrong while submitting the form.
Questions? We have answers
Which attribution model is best for B2B marketing?
B2B journeys are long and multi-touch, so single-touch models rarely fit. Linear gives a balanced baseline across a sprawling journey, U-shaped credits the first contact and the lead-conversion moment that most B2B teams care about, and W-shaped adds opportunity creation as a third weighted stage for enterprise funnels with defined pipeline stages. The more your sales cycle runs through a CRM, the more a multi-touch or W-shaped model has to offer.
What is the difference between single-touch and multi-touch attribution?
Single-touch models assign all the conversion credit to one interaction—either the first or the last. Multi-touch models share the credit across several interactions in the journey. Single-touch is faster and simpler but ignores everything except one touchpoint; multi-touch gives a fuller picture of how a conversion came together, at the cost of needing more data and more setup.
Is last-click attribution still effective in 2026?
It is still widely used and still useful as a quick, simple read, particularly for short purchase cycles. It is no longer trusted as a complete measure: it overcredits the final touchpoint and hides the awareness work that fed the journey, which is why even Google has moved data-driven attribution to the default in Google Ads and GA4. Last-click works best now as one input among several, not the whole verdict.
How does data-driven attribution work?
Data-driven attribution uses machine learning trained on your historical conversion data to distribute credit dynamically. Rather than applying a fixed rule, it compares the journeys of customers who converted against those who did not and infers which touchpoints actually influenced the outcome, adjusting the weighting as patterns change. It tends to be the most accurate approach when there is enough clean data to train it, and the least transparent when there is not.
What are the biggest limitations of attribution models?
The largest is that attribution shows correlation, not causation—a touchpoint before a conversion is not proof it caused the sale. Beyond that, platforms inflate their own credit, fragmented cross-device journeys break tracking, offline influence goes largely unmeasured, and privacy changes have reduced the user-level visibility detailed attribution depends on. None of these is fixed by switching models.
What is the difference between attribution and Media Mix Modeling (MMM)?
Attribution works at the level of the individual journey, crediting specific touchpoints and refreshing quickly, which makes it good for tactical, in-flight decisions. MMM works at the aggregate level, analysing total spend and outcomes over months to estimate each channel's overall contribution, including offline and upper-funnel activity, which makes it good for strategic budget allocation. They answer different questions and work best together.
How can businesses improve attribution accuracy across channels?
Combine methods rather than relying on one—attribution for optimization, MMM for allocation, incrementality for causal proof. Keep the underlying data clean through regular tracking and CRM audits, since attribution is only as good as its inputs. Use neutral, cross-channel measurement rather than any single platform's self-reported numbers, and align the model you choose with the specific goal you are measuring against.
Have other questions?
If you have more questions, contact us so we can help.
Questions? We have answers
This is some text inside of a div block.
Lorem ipsum dolor sit amet, consectetur adipiscing elit. Suspendisse varius enim in eros elementum tristique. Duis cursus, mi quis viverra ornare, eros dolor interdum nulla, ut commodo diam libero vitae erat. Aenean faucibus nibh et justo cursus id rutrum lorem imperdiet. Nunc ut sem vitae risus tristique posuere.
This is some text inside of a div block.
Lorem ipsum dolor sit amet, consectetur adipiscing elit. Suspendisse varius enim in eros elementum tristique. Duis cursus, mi quis viverra ornare, eros dolor interdum nulla, ut commodo diam libero vitae erat. Aenean faucibus nibh et justo cursus id rutrum lorem imperdiet. Nunc ut sem vitae risus tristique posuere.
This is some text inside of a div block.
Lorem ipsum dolor sit amet, consectetur adipiscing elit. Suspendisse varius enim in eros elementum tristique. Duis cursus, mi quis viverra ornare, eros dolor interdum nulla, ut commodo diam libero vitae erat. Aenean faucibus nibh et justo cursus id rutrum lorem imperdiet. Nunc ut sem vitae risus tristique posuere.
This is some text inside of a div block.
Lorem ipsum dolor sit amet, consectetur adipiscing elit. Suspendisse varius enim in eros elementum tristique. Duis cursus, mi quis viverra ornare, eros dolor interdum nulla, ut commodo diam libero vitae erat. Aenean faucibus nibh et justo cursus id rutrum lorem imperdiet. Nunc ut sem vitae risus tristique posuere.
This is some text inside of a div block.
Lorem ipsum dolor sit amet, consectetur adipiscing elit. Suspendisse varius enim in eros elementum tristique. Duis cursus, mi quis viverra ornare, eros dolor interdum nulla, ut commodo diam libero vitae erat. Aenean faucibus nibh et justo cursus id rutrum lorem imperdiet. Nunc ut sem vitae risus tristique posuere.
This is some text inside of a div block.
Lorem ipsum dolor sit amet, consectetur adipiscing elit. Suspendisse varius enim in eros elementum tristique. Duis cursus, mi quis viverra ornare, eros dolor interdum nulla, ut commodo diam libero vitae erat. Aenean faucibus nibh et justo cursus id rutrum lorem imperdiet. Nunc ut sem vitae risus tristique posuere.
This is some text inside of a div block.
Lorem ipsum dolor sit amet, consectetur adipiscing elit. Suspendisse varius enim in eros elementum tristique. Duis cursus, mi quis viverra ornare, eros dolor interdum nulla, ut commodo diam libero vitae erat. Aenean faucibus nibh et justo cursus id rutrum lorem imperdiet. Nunc ut sem vitae risus tristique posuere.

.svg)
.svg)